
1.- Comprehensive overview of the project: state-of-the-art
A state-of-the-art was developed in order to provide a comprehensive overview of the project.
D1.2 Comprehensive overview of the project
2.- Baseline mapping of relevant ecosystems
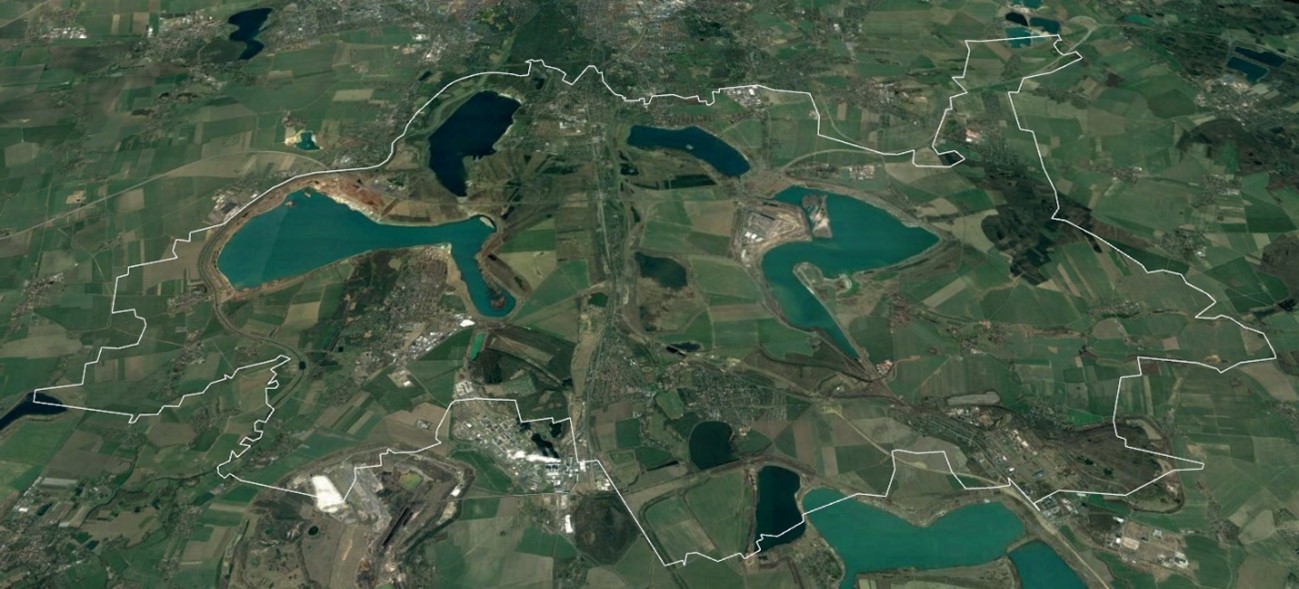
In the first place, and after a detailed description of each case study, the adequate boundaries for the study areas were defined based on the existing spatial connectivity and functional cohesion.
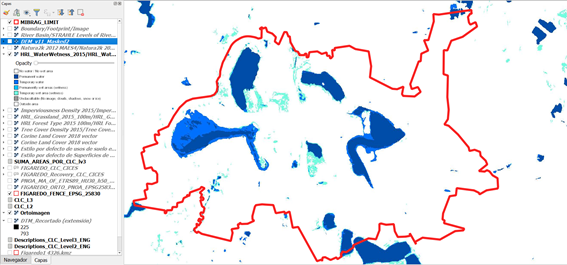
In the second place, a revision of the available online geospatial data was developed and was obtained mainly from CORINE Land Cover, COPERNICUS Land monitoring System and COPERNICUS imagery and reference data.
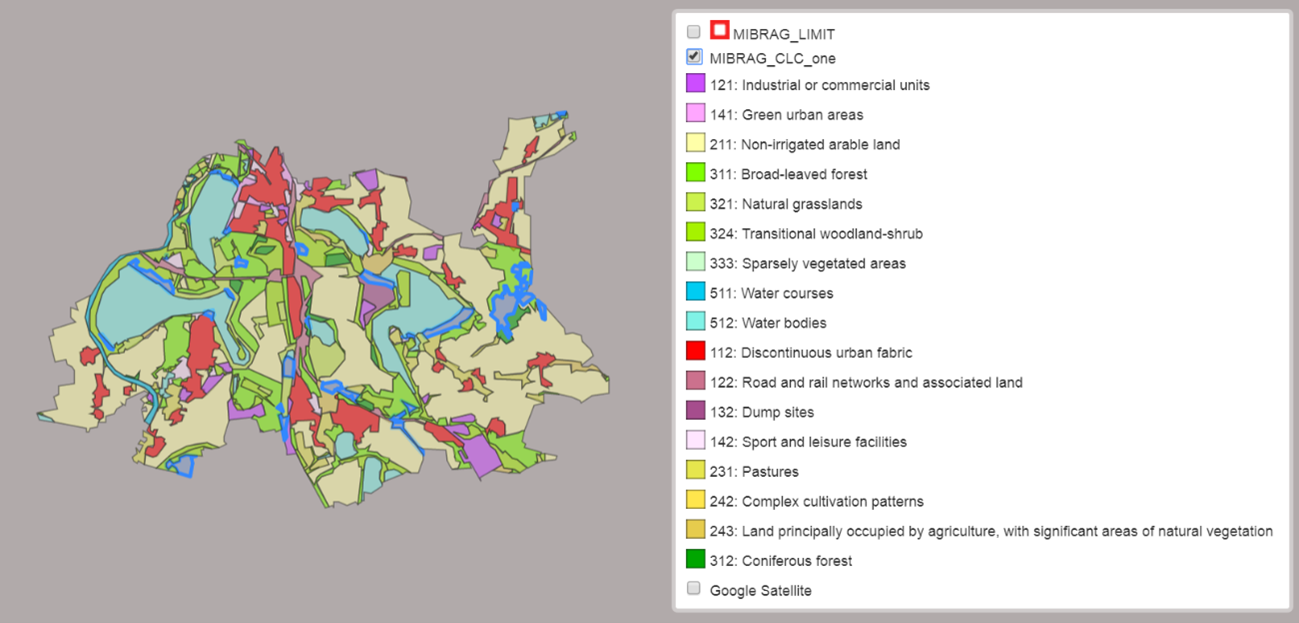
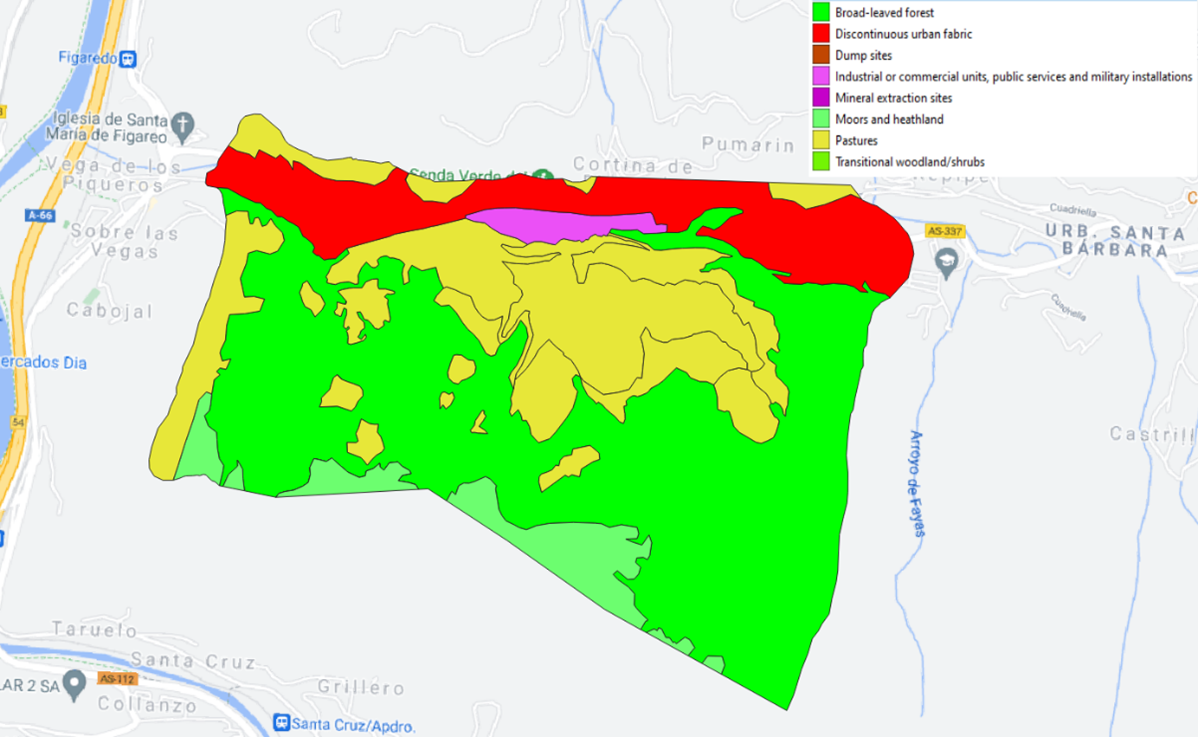
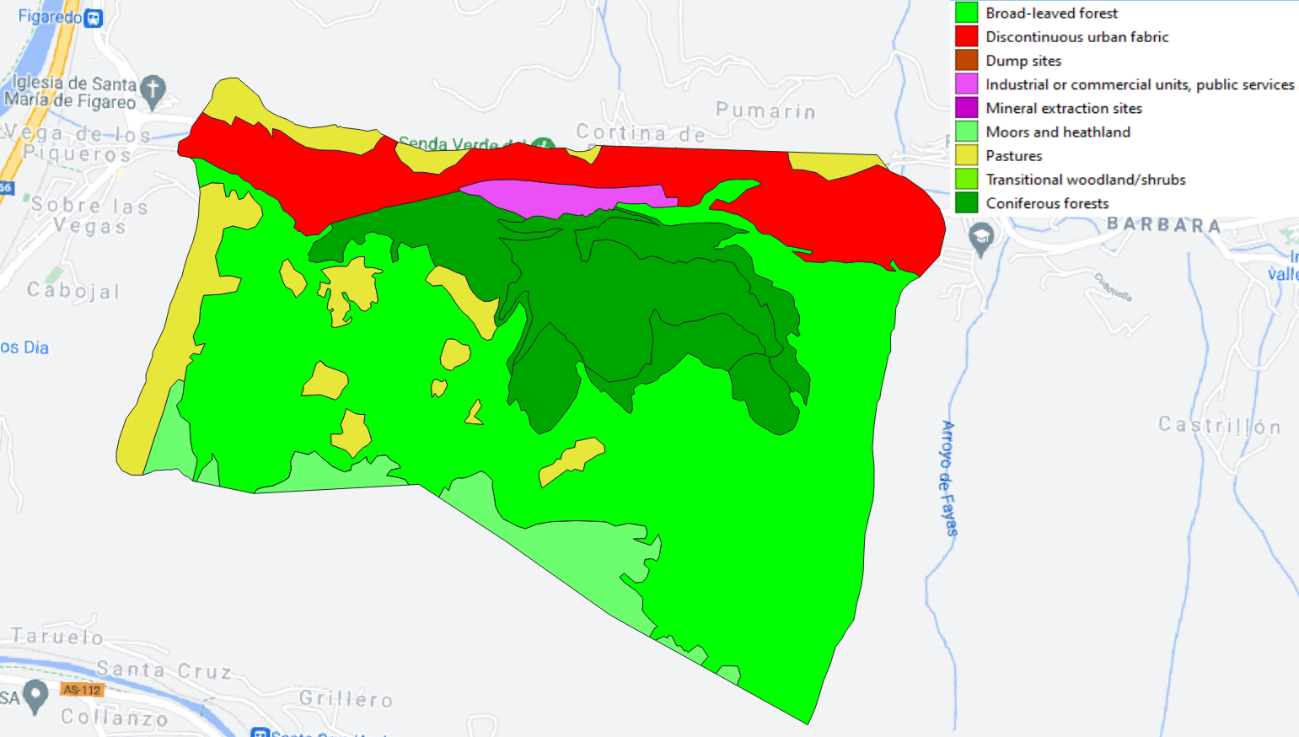
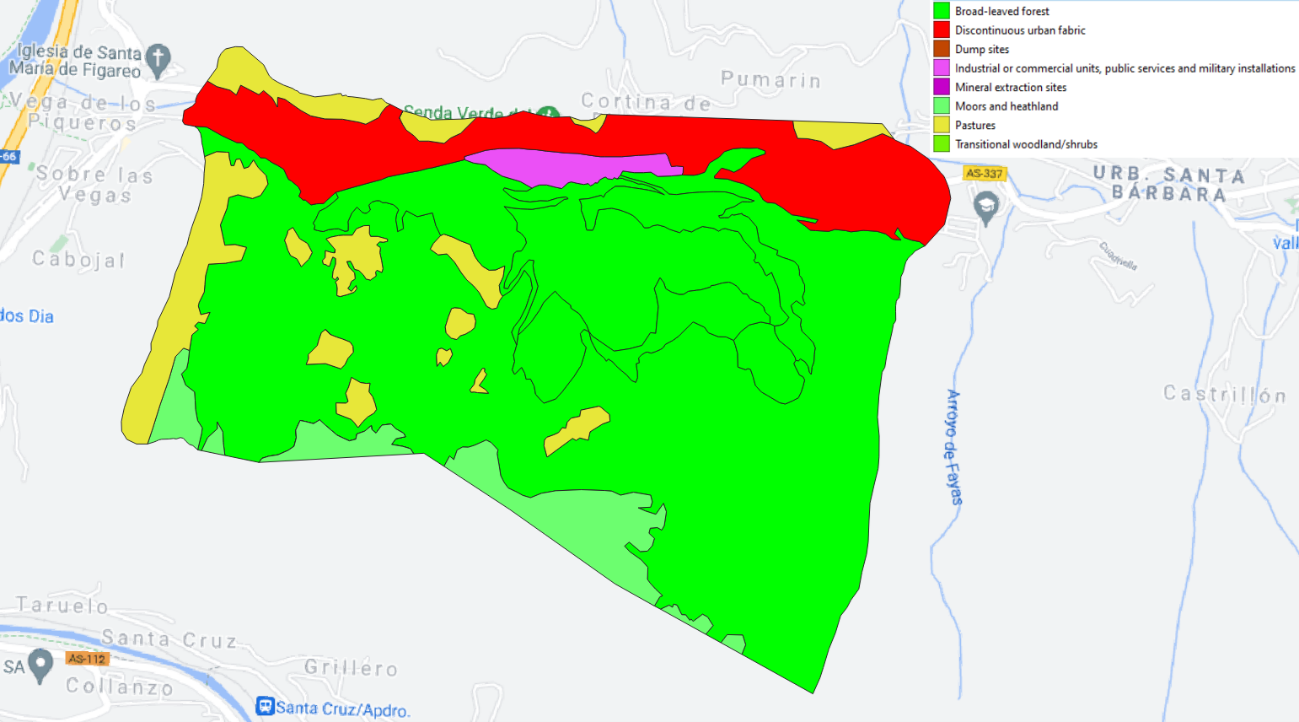
In the third place, CORINE Land Cover (CLC) classes (level 3) were used to delineate, categorize and map the different ecosystem types of land cover in the study areas, ensuring the comparability of the land use classes, although doing detailed field mapping at a higher resolution.
Finally, the information was introduced in the QGIS 3.8 Zanzibar (QGIS was previously known as Quantum GIS). The result for each case study can be accessed in the WebGIS area of the webpage.
D2.1 Baseline mapping of relevant ecosystems of Figaredo Mine
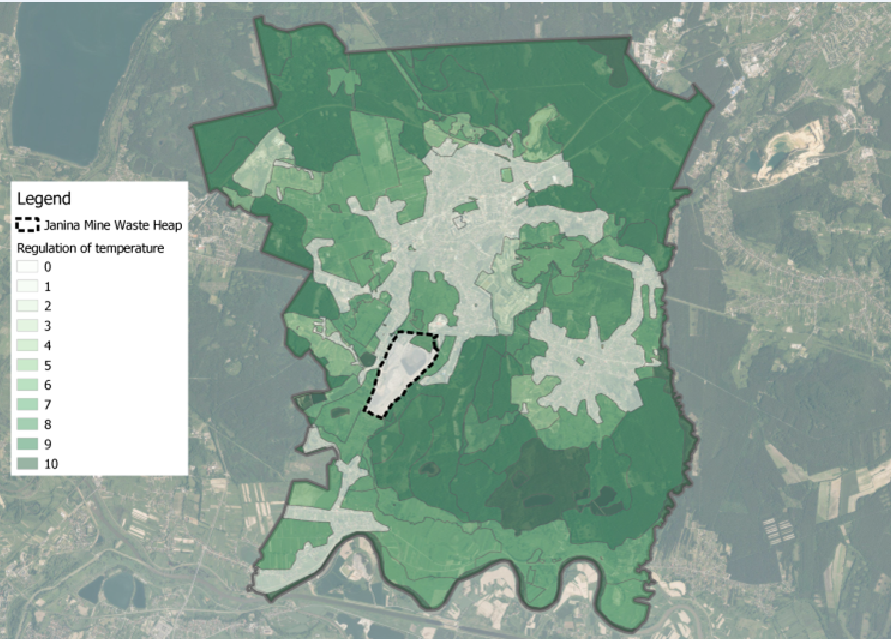
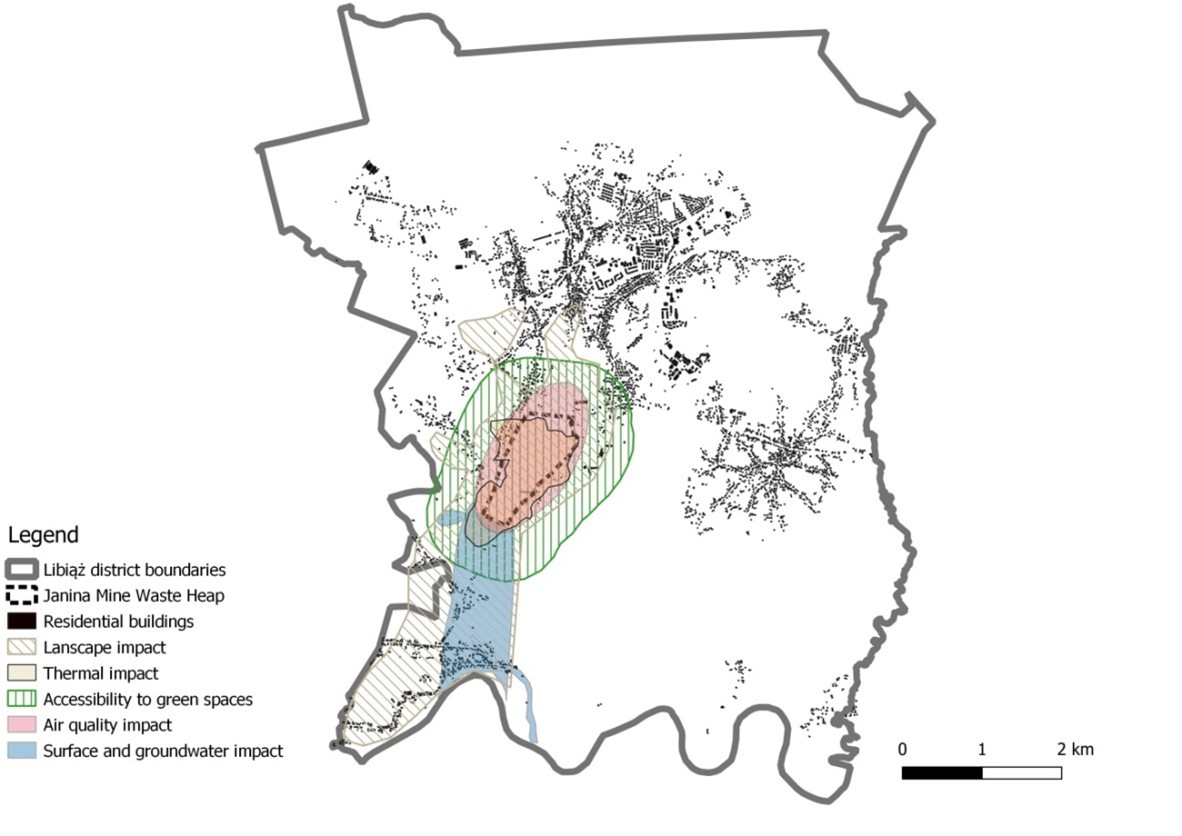
D2.2 Baseline mapping of relevant ecosystems of Janina Mine Waste Heap
D2.3 Baseline mapping of relevant ecosystems of Ema-Terezie Mine dumps complex
D2.4 Baseline mapping of relevant ecosystems of Chabařovice mine and Most-Ležáky Mine
D2.5 Baseline mapping of relevant ecosystems of Mibrag Mines
The lessons relevant to RECOVERY from the baseline mapping of relevant ecosystems of the case studies can be summarised as follows:
- Identifying the adequate boundaries of the case-study area can be challenging work. Selecting a considerable size within the boundaries will end in much work related to mapping. Choosing a small site may risk not selecting representative land covers and potential ecosystem services. The use of administrative boundaries, socio-economic areas or spatial ranges on environmental pressure can help to set the appropriate boundaries.
- There is a considerable amount of geospatial data available, mainly from CLC, COPERNICUS Land Monitoring System, COPERNICUS imagery and reference data, and national repositories. In combination with information provided by Google Earth, all of these facilitate the task of categorising and mapping the relevant ecosystems, although at a higher resolution than in the CORINE programme.
- The mapping of a study area can be quickly done even by people without experience with GIS. Google Earth polygons are easy to build and easy to export to almost any GIS.
3.- Assessment of ecosystem services
The assessment method is based on the Common International Classification of Ecosystem Services (CICES) V5.1.
The relevance of the ecosystem services (ES) is guided by the importance of the respective ecosystem services for the post-mining development of the landscape. The relevant ES have to provide economic alternatives for the mining-based economy and to support the economic viability of the transformation process. The relevance of the regulating services is guided by the environmental conditions from the transformed mining landscape, which have to be regulated to support the living conditions in the post-mining area. The cultural services relevant to the study area contribute to the aesthetic restoration of the post-mining landscape and can also provide economic opportunities based on the touristic attractiveness of the reclaimed post-mining landscape. Finally, the provisioning services in the assessment represent the base for economic alternatives to the mining-related economy.
The ES were selected from CICES V5.1 according to the CLC classes of the study areas, the topography, as well as the environment and the specific climate. Other two criteria were also used for the selection: representing important ES in urban ecosystems and representing different sections of the list of ES developed by the Economics of Ecosystems and Biodiversity Ecological and Economic Foundations (TEEB, 2010).
Also, the following references were closely followed: Larondelle & Haase (2012), that valuated post-mining landscapes; Kain, Larondelle, Haase, & Kaczorowska (2016), that explored local consequences of two land-use alternatives for the supply of urban ES; Baró, Gómez-Baggethun, & Haase (2017) that advanced a framework to identify, map and assess ES bundles from a supply-demand approach to inform landscape planning and management; and Pueffel, Haase, & Priess (2018) that provided a clear overview of the respective classes and subgroups adapted according to the CICES framework 4.3.
From each ES, the following information was collected: CICES V5.1 class level, ES indicator, measuring methods, scientific references, primary data sources, type of valuation and sources of uncertainty.
D2.6 Assessment of ecosystem services of Figaredo Mine
D2.7 Assessment of ecosystem services of Janina Mine
D2.8 Assessment of ecosystem services of Ema-Terezie Mine dumps complex
D2.9 Assessment of ecosystem services of Chabařovice mine and Most-Ležáky Mine
D2.10 Assessment of ecosystem services of Mibrag Mine
The lessons relevant to RECOVERY from the assessment of ES of the case studies can be summarised as follows:
- The CICES is designed to capture as many ES as possible. In the case of provisioning services, the division between the classes is comprehensible. The categories of regulating services are less clear, and the categories of cultural ES are least clear.
- Another challenge of applying the CICES is alternative ES from the same land cover. Some ES can be realized in the same area and can only be achieved at the expense of the other respective service. Other ES can both be realized without interference.
- The above-mentioned challenges can be met by considering the local context of the ES. The local demand for ES provides a good guideline to identify the ES that is relevant in the local context. The issue of rivalling ES should be considered in selecting ES for the assessment.
- The above-mentioned challenges can be met by considering the local context (local demand) of the ES. Which benefit that will be derived from the land cover finally depends on a variety of factors depending on local as well as regional and even global socio-economic conditions.
4.- Blueprint instrument/indicator
The blueprint instrument/indicator provides a method to project the future development of the post-mining landscape based on the transformation decisions for the post-mining LC change by using scenarios of post-mining landscape transformation. The one presented here uses a tiered approach, which is based on the assessment of land cover (LC), from which landscape metrics are assessed based on the landscape metrics ecosystem services (ES) of the investigated mining and post-mining landscapes.
The assessment of the LC aims to identify the composition of the landscape. The assessment of landscape metrics informs the assessment of ES about the amount of ES which can be expected from the landscape depending on the size of the area of each LC class. From the calculation of the patch sizes, a quick overview of the direct impact of the mining activities is possible. The assessment of ES is the next step in the blueprint instruments/indicators procedure. Within the blueprint instrument/indicator procedure, the ES approach connects the evaluation of the LC and landscape metrics to the benefits for human society.
Within the blueprint instruments/indicator procedure, the scenarios provide the framework for the assessment of LC changes in the post-mining period. There are a lot of different approaches to the development of scenarios, and as scenarios are assumptions of future developments they are, to a certain degree, fictional. It is, therefore, important to develop storylines which are internally consistent and comprehensible. This report demonstrates a method to operationalize the developed storylines. Transition rules are one way to systemize the LC change based on the storylines.
The application of the blueprint instrument/indicator procedure is demonstrated by two case studies. The first case study builds on exploratory work in the post-mining area south of Leipzig (the Mibrag Mines area). The second case study explores the application of the blueprint instruments/indicators approach to an area with an active underground mining operation in Poland.
D3.1 Blueprint instrument-indicator
The lessons relevant to RECOVERY from the development of the Blueprint instrument/ indicator can be summarised as follows:
- The subject of LC transformation is very complex and involves several complex measures, which are designed to provide additional in-depth information on landscape transformation. However, the use of the respective spatial statistics is not feasible compared to the information gained by the interpretation of these statistics. In addition, this would generally overburden the capacities of most stakeholder involvement, as very specialized knowledge is needed for comprehension. The blueprint instrument/indicator thus uses the most basic landscape metrics, which are easy to apply and comprehend.
- A second lesson concerns the generation of scenarios. The storylines of scenarios are not instructions on how to reclaim the former mining sites. They are assumption-based projections with uncertainties regarding unexpected developments, external pressures or changes in ES demands. The scenarios are supposed to inform stakeholders of how reclamation can develop and agree on visions of the reclamation of former mining sites.
- Based on the experiences from the two case studies, it is recommended that the choice of ES should be open for the local experts applying the instruments/indicators to decide based on their local knowledge. Comparability of the results is limited so far. Based on the standardization of indicator values, an estimation of the expected ES supply is possible.
5.- Artifical substitutes for soils in difficult terrains
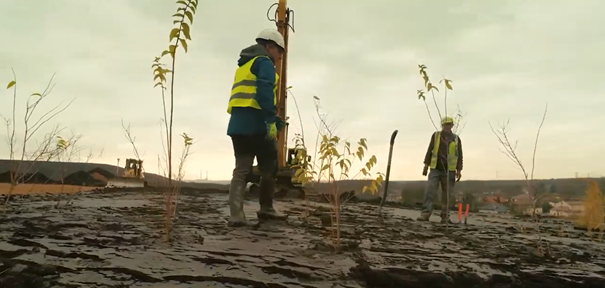
The research tries to develop soil substitutes for evaluating land rehabilitation of coal mine-affected areas (waste heaps), outlining a novel approach to the use of wastes generated in coal mines and coal-fired power plants. The following coal combustion by-products were included: fly ashes from coal and biomass combustion, aggregate from mine waste processing, sealing material and energetic slag. Additionally, sewage sludge and spent mushroom compost were incorporated into the elaboration of soil substitutes as substrates enriching with organic matter and valuable nutrients. The selected wastes are generated in coal mines, coal-fired power plants, agriculture industries, and residues from wastewater plants.
Based on the physical and chemical characteristics of the investigated wastes, soil substitutes were prepared by appropriate blending of wastes. Soil substitutes differed from each other in terms of the type of waste and their percentage share. Two types of tests were carried out in order to assess the suitability of each soil substitute for vegetation development. In the first place, white mustard (Sinapis alba) was used as the typical plant for the seed germination test. In the second place, seeds of semi-natural meadow communities were additionally used. They were represented by plant species typical for meadow communities in Central Europe. Taking into consideration habitat conditions on waste heaps slopes, the species with low (dry meadow) and middle soil moisture requirements (mesic meadow) were used.
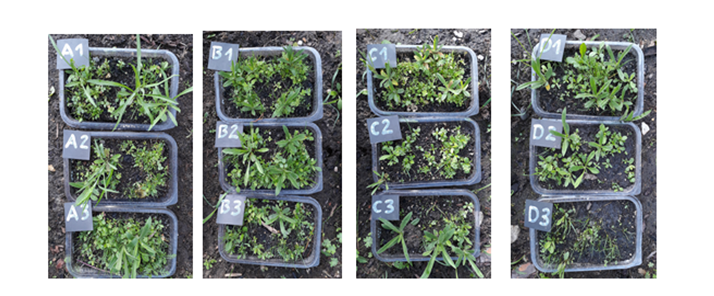
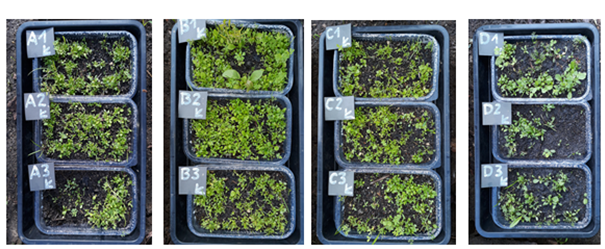
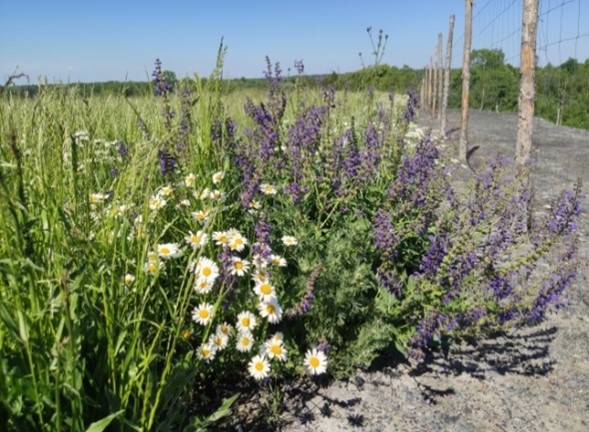
Currently, the evaluation of semi-natural meadow communities such types of reclaimed coal-mine affected areas has already started at Libiąż waste heap. The mining waste heaps seem to offer a suitable area for these types of semi-natural communities’ development. This work will continue till September 2022.
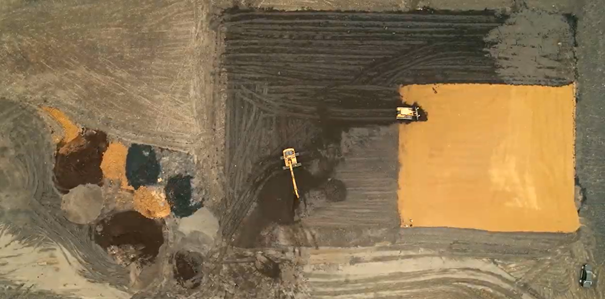
The following photographs show the state of the reclaimed area in April 2022 (top left area in the photograph on the left).
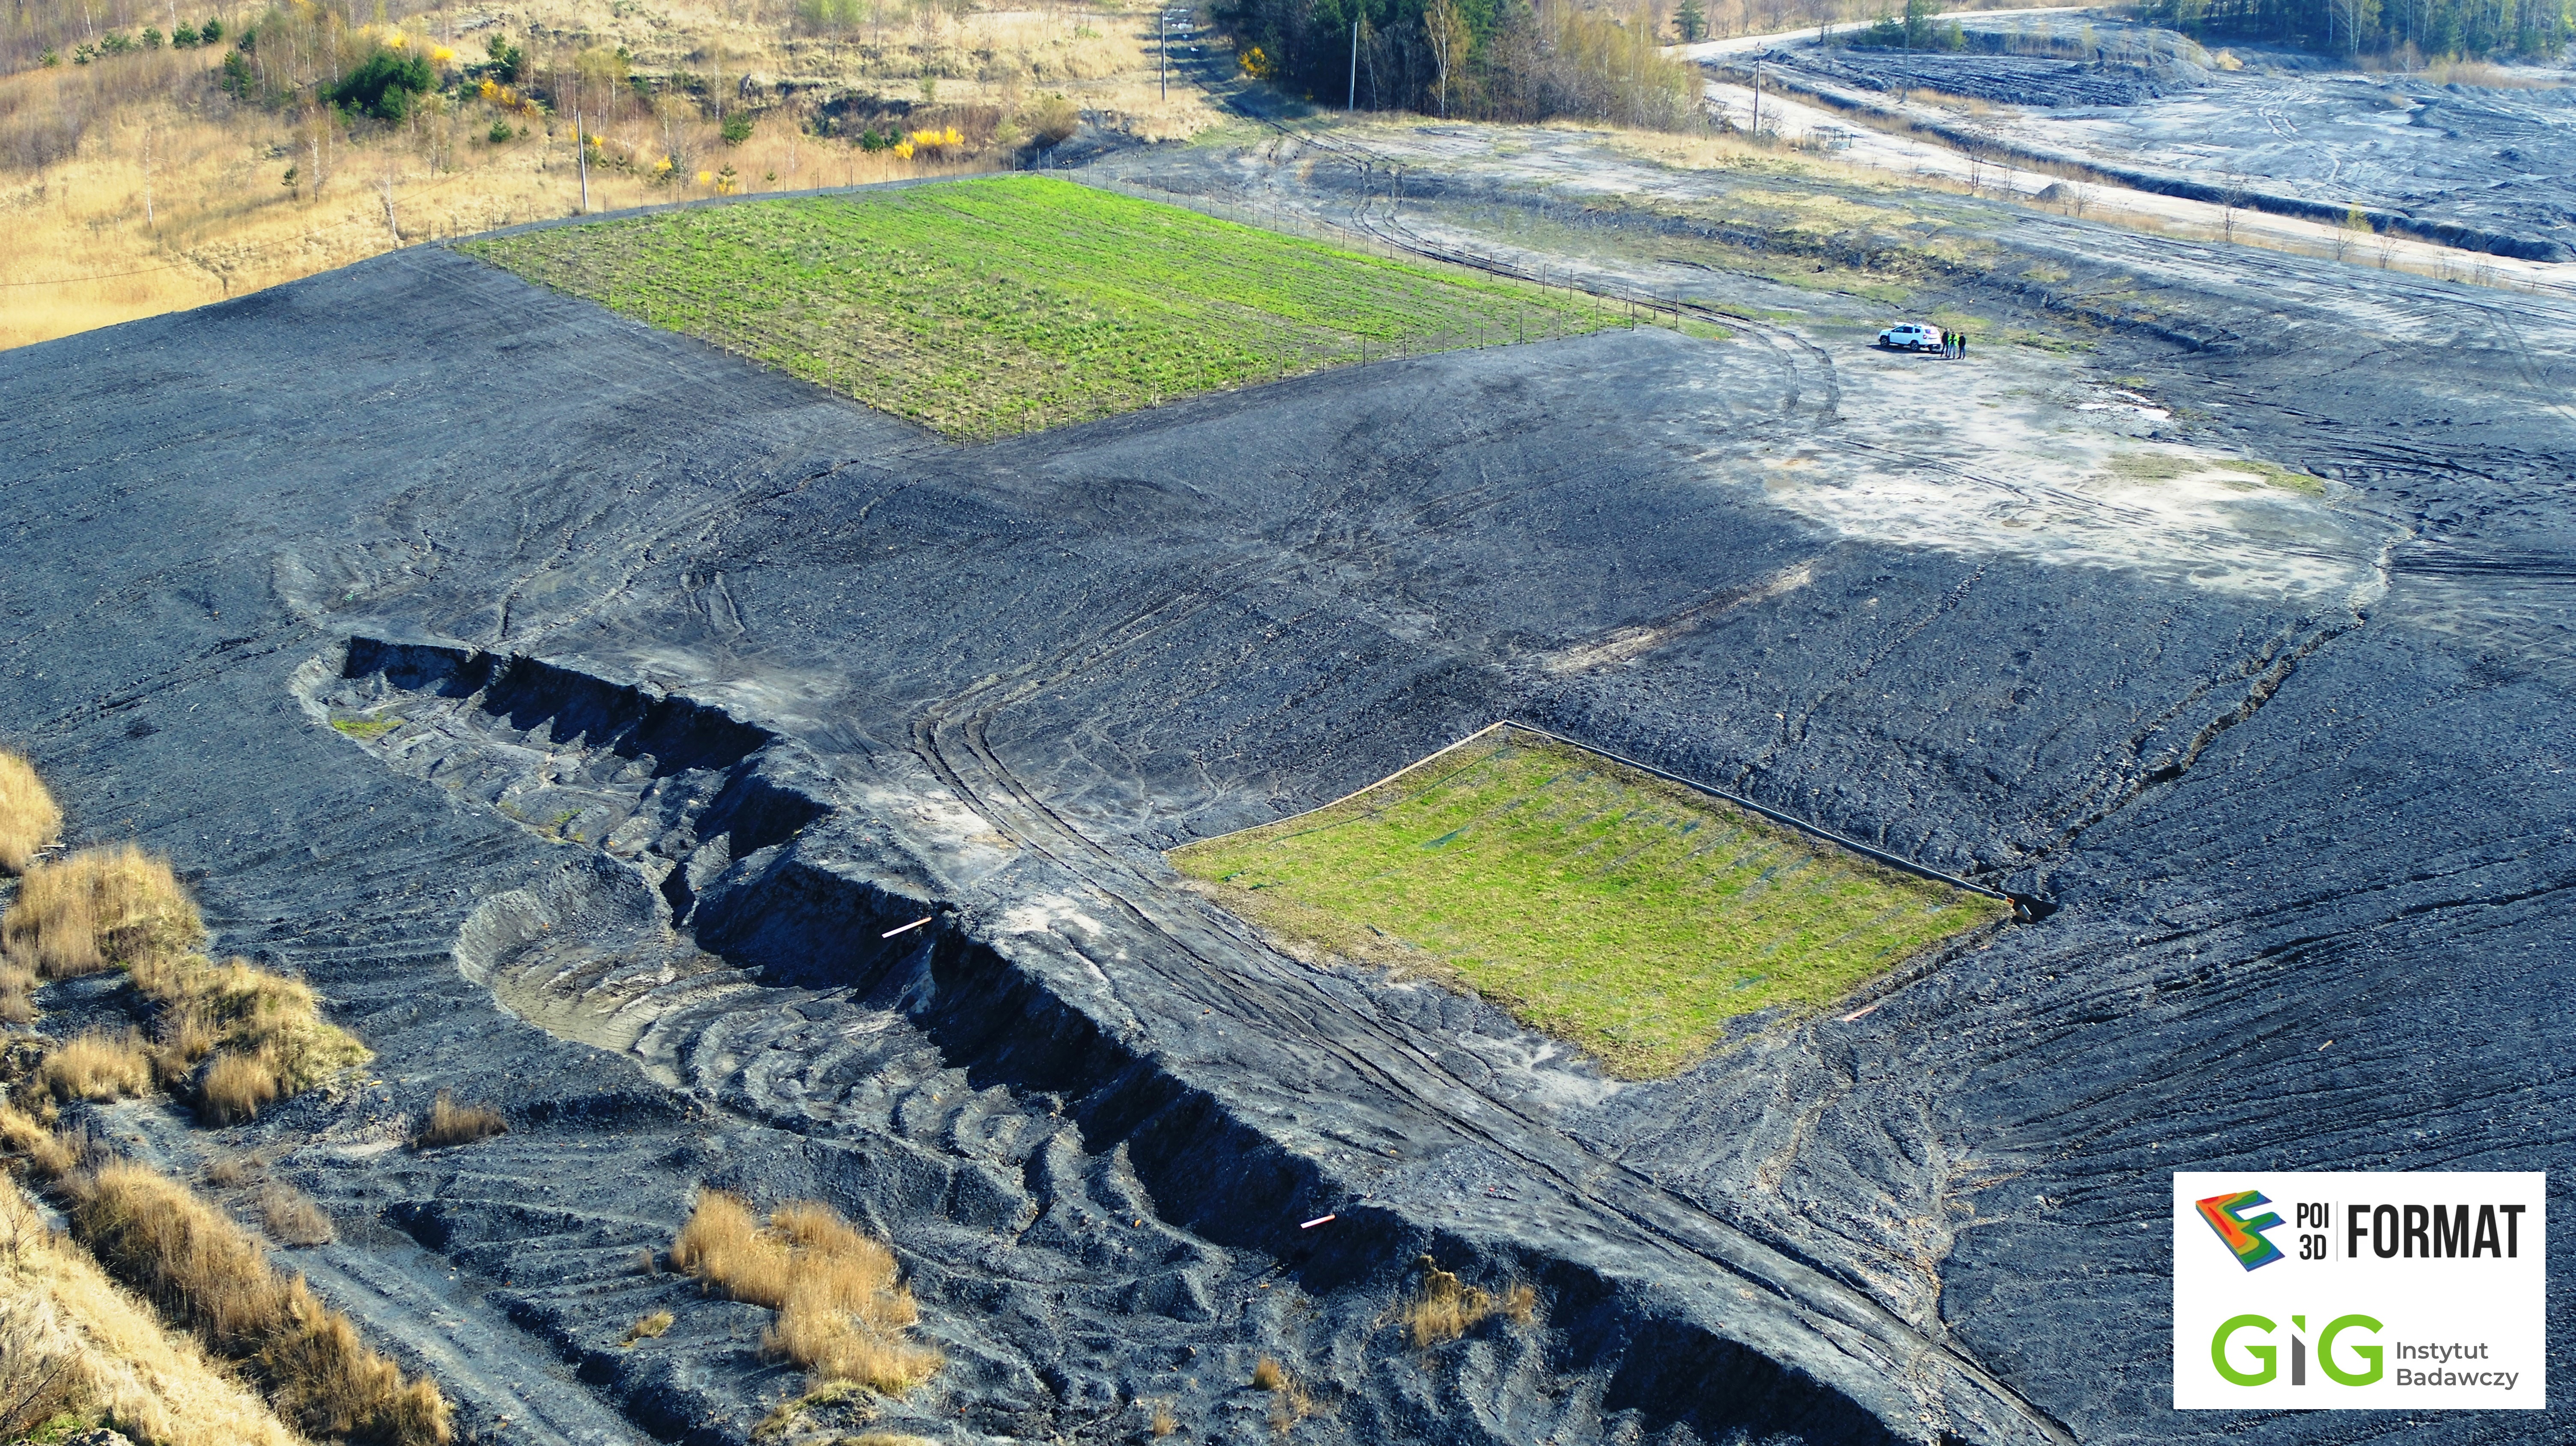
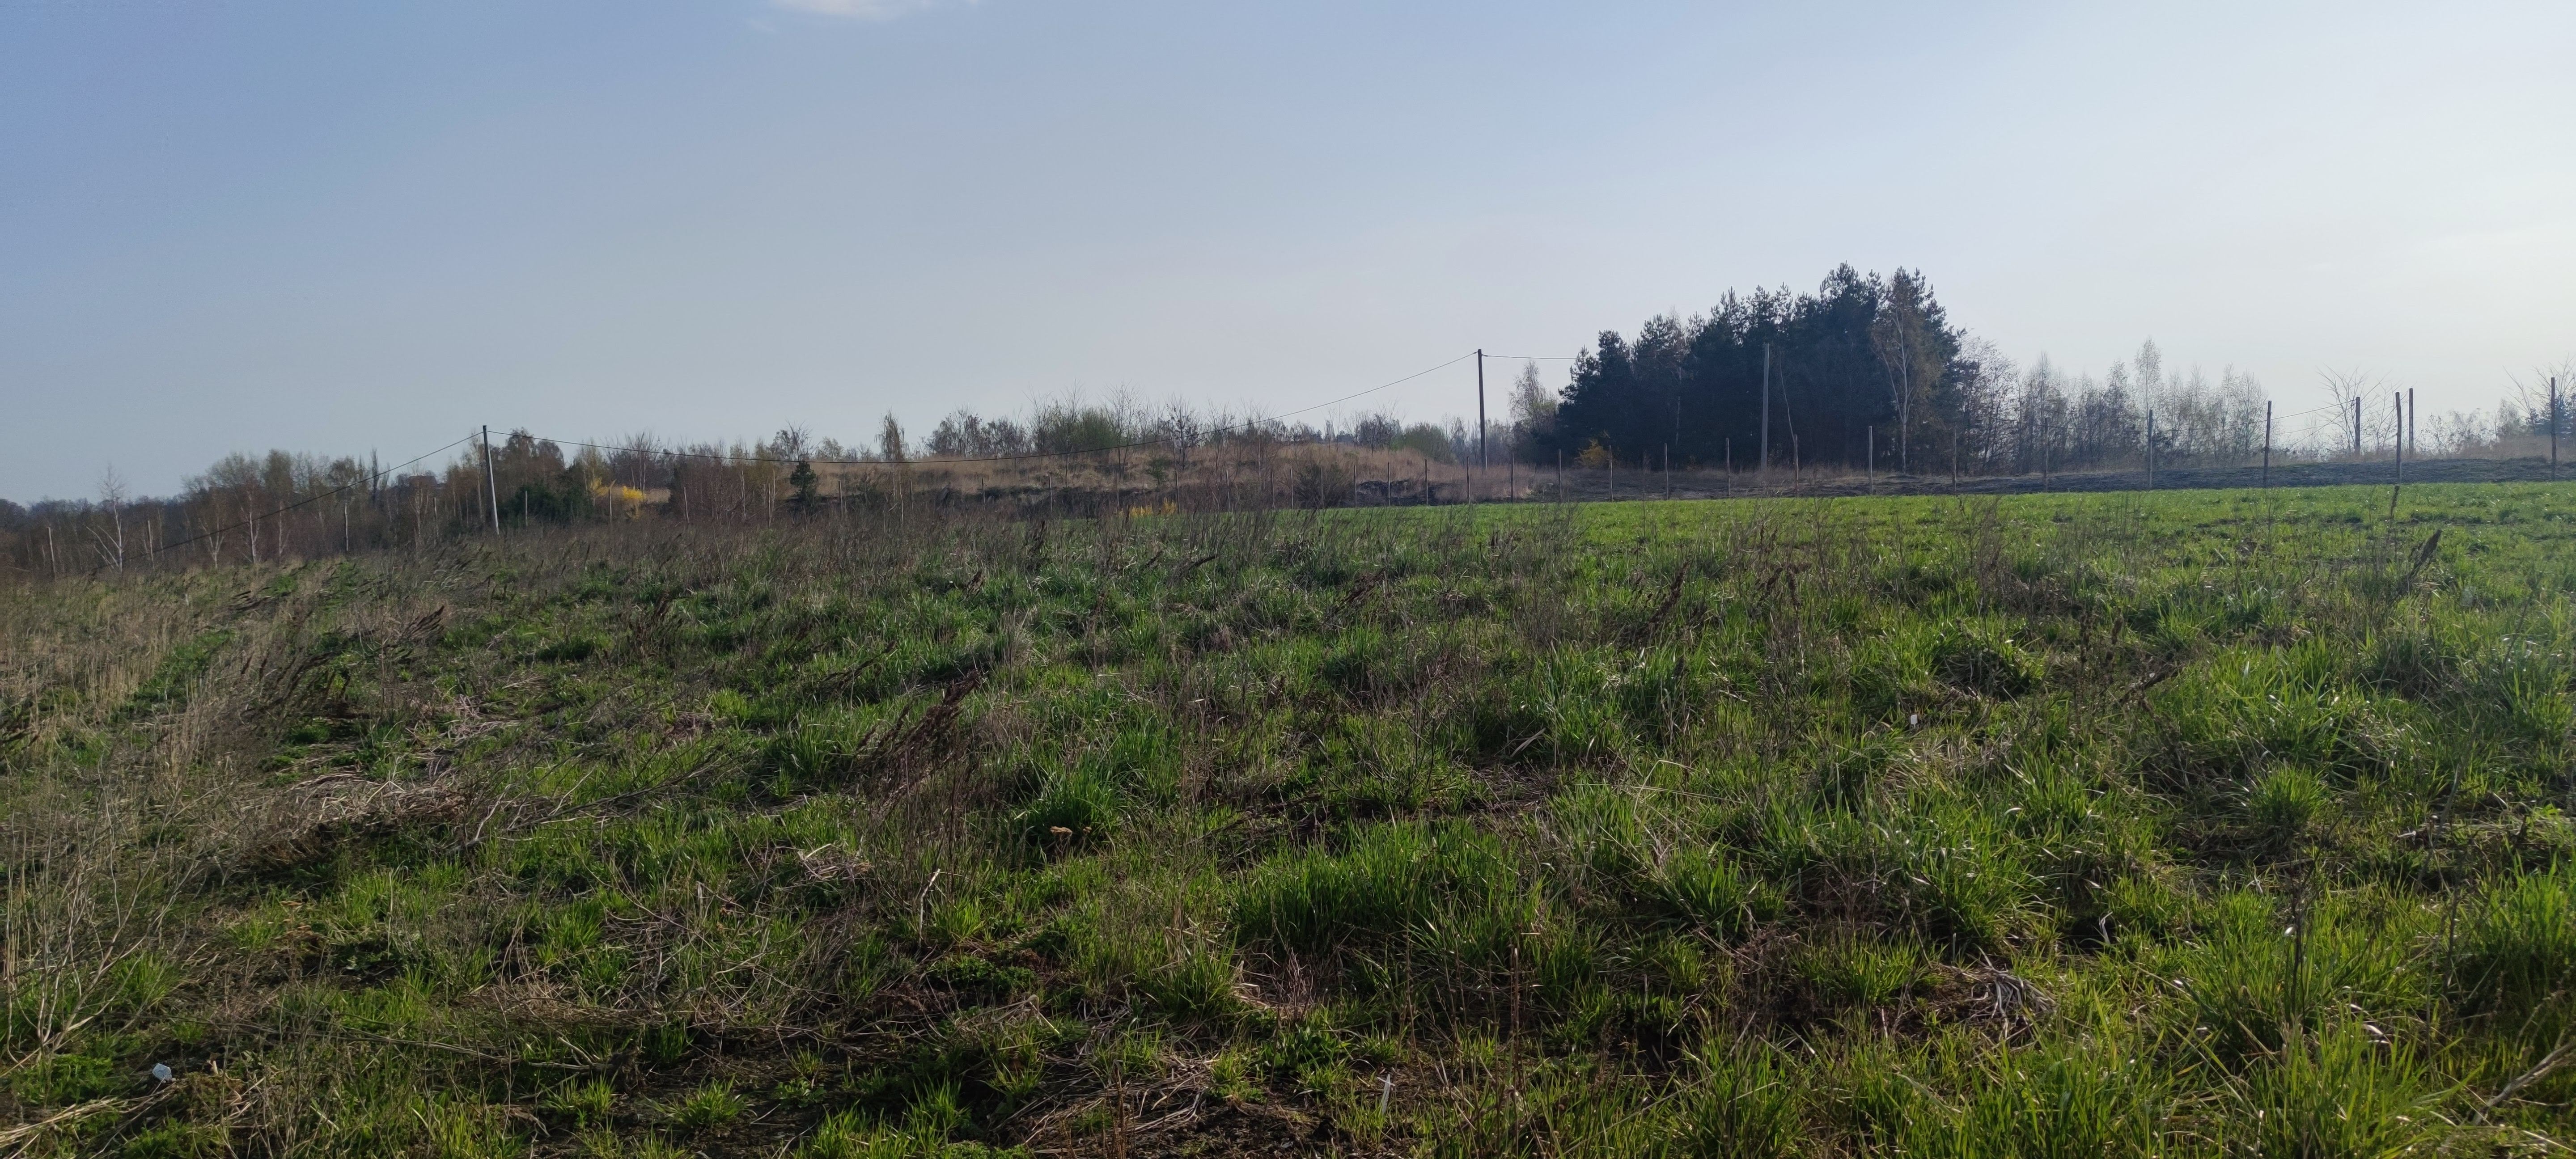
The following photographs show the development of meadow vegetation using soil covers at Janina Mine waste heap: mesic meadow vegetation and dry meadow vegetation.

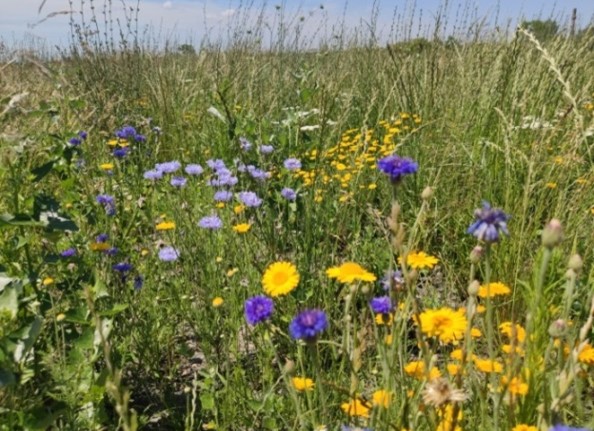
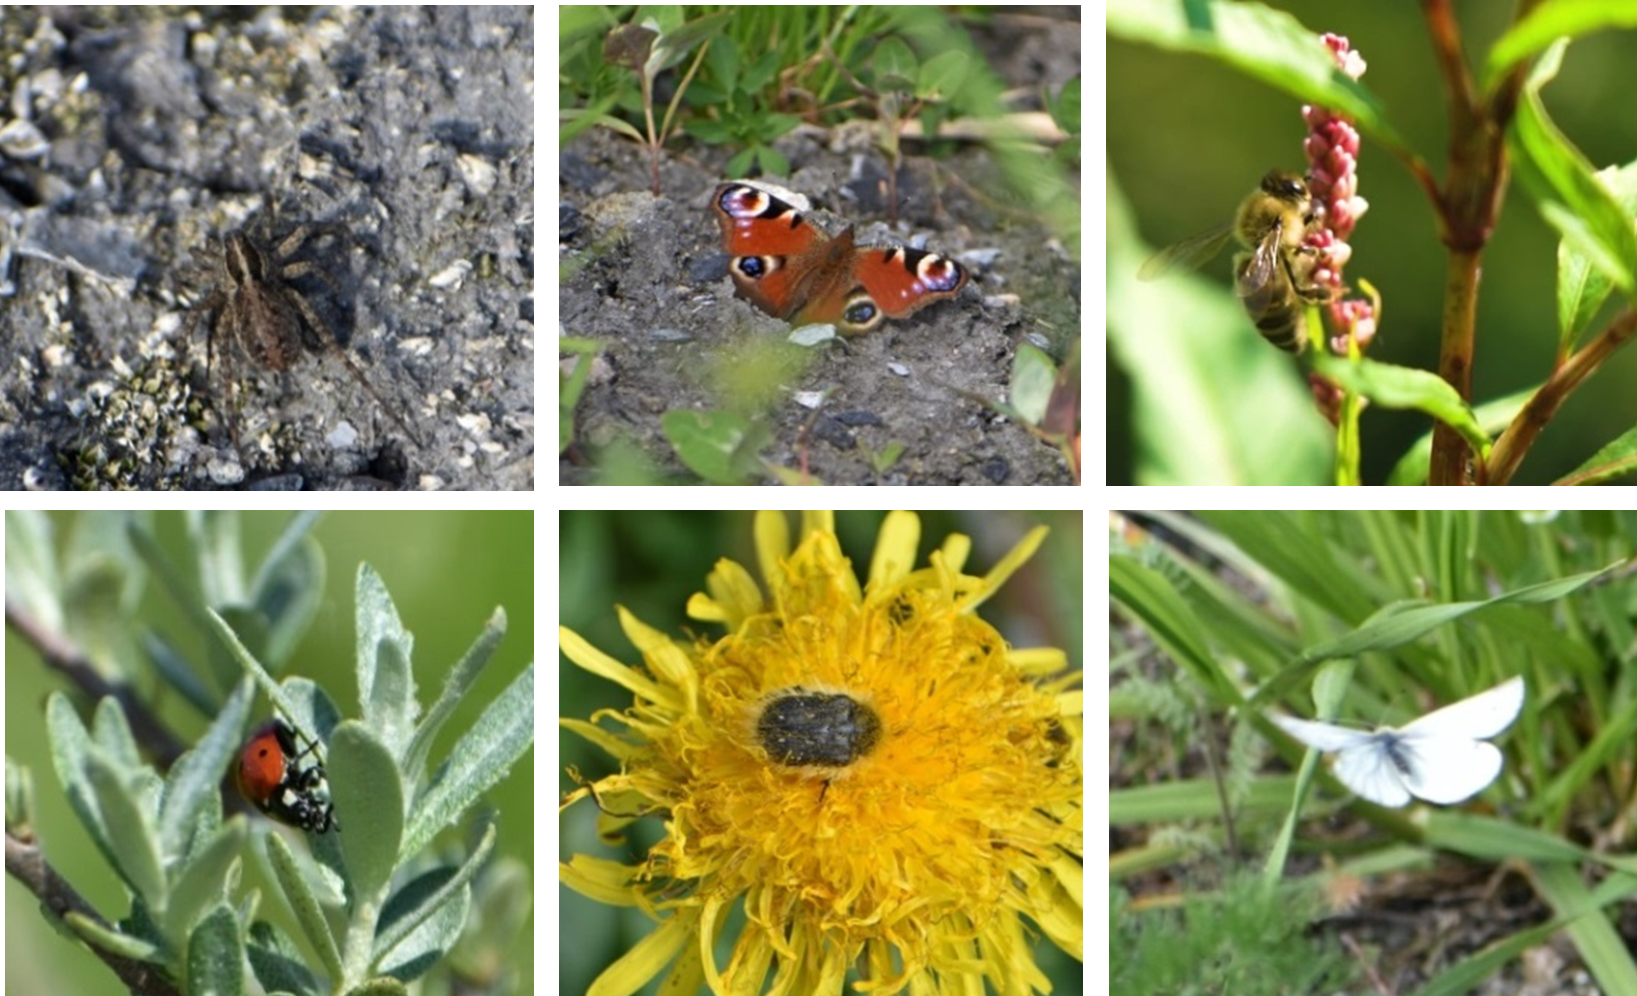
The following photographs show examples of fauna observed on the experimental polygon after reclamation.
D3.2 Artificial substitutes for soils in difficult terrains
The lessons relevant to RECOVERY from the development of artificial substitutes for soils in difficult terrains regarding the laboratory tests can be summarised as follows:
- It is essential to explore the local market for suppliers of by-products from coal combustions, coal mines, and organic matter-rich material before developing soil substitute mixtures.
- The first stage of laboratory testing of components can be limited to testing the aqueous extracts prepared for waste according to EN 12457-4:2002 Characterization of waste – Leaching – Compliance test for leaching of granular waste materials and sludges – Part 4: One stage batch test at a liquid to solid ratio of 10 l/kg for materials with particle size below 10 mm (without or with size reduction).
- The parameters for the aqueous extract tested in the first stage can be limited to pH, electrolytic conductivity, primary ions and main heavy metals.
- Waste with the lowest possible pH and electrolytic conductivity should be qualified for further testing and analysis. This condition is usually met by power plant slags, which are in contact with process waters during manufacturing.
- When preparing substitute mixtures, it is crucial to limit the number of components providing the ones that ensure: (1) proper soil structure – skeleton-building components (energy slags, fine aggregate); (2) fine-fraction components that retain water – decarbonization lime and sealing material (from coal dressing plants); (3) organic carbon-rich and structure-enhancing ingredients (spent mushrooms compost).
- The use of sewage sludge, due to its smear-like consistency and high nitrogen content, is not required and may even be inadvisable. A disproportionate share hinders soil homogenization and can cause excessive growth of inoculated plant biomass.
- Fly ashes from coal and biomass combustion should also be avoided in the composition of soil substitutes. This component causes high pH and salinity in the soil substrate mixture. The soil substrate’s high pH and conductivity indicate unfavourable conditions for plant growth.
Regarding the polygon test construction phase as well as the plant introduction, the main lessons learnt were as follows:
- The construction of a reclamation layer using the 2-layer technology is logistically easier but requires very precise homogenisation of soil substitute with mine waste in a 1:1 ratio.
- In areas in the temperate transitional climate zone (cold winter, warm summer), the testing ground and plant sowing should be constructed in late autumn, avoiding the negative impact of extreme summer weather events (drought, heavy rainfall) on an unplanted reclaimed area with young germinating vegetation.
- Agrotechnical treatments should be carried out perpendicular to the slope to reduce erosion.
- In the case of planting shrub seedlings, the use of fencing against animals is necessary.
- Agro-fibre should be spread around planted young shrubs to separate them from overly expansive herbaceous plants.
- Meadow communities in the first years of vegetation should be mowed once a year, in autumn, before the sowing period of undesirable plants. After the first and the second mowing, the biomass can be left on the reclaimed area to reduce water erosion.
- Botanical studies have not shown a significant difference in the conditions of vegetation introduced on a polygon built using the 2-layer technology (cheaper technology) and the multi-layer technology (more expensive technology). Thus, the 2-layer method could successfully reclaim post-mining waste heaps as a more affordable and equally effective method.
Multi-layer technology is recommended on the part of the heap where an intensive process of rainwater infiltration occurs and the risk of acid drainage appearance is high (e.g. flat top of the heap).
6.- Assessment of rehabilitation techniques for waste heaps
An assessment of rehabilitation techniques for waste heaps in Figaredo Mine and in the Ema-Terezie mine dumps complex was developed.
Regarding Figaredo Mines, water analyses were collected above the waste dump, in the waste dump and below the waste heaps. Soil analysis was also developed at a place that was already restored. Also, an above-ground vegetation comparative assessment at Figaredo Mine was developed in order to determine the degree of vegetal development of the restored waste heaps.
Regarding the Ema-Terezie mine spoils dump, research has been focused on the evaluation of individual ecological factors that affect both the reclamation methods used and the subsequent development of vegetation, fauna and soils in dumps after mining activities. The following aspects were analysed: hydrological properties of the area, development of soils, character, development of vegetation including phytocenological evaluation, the occurrence of rare and endangered plant species, the occurrence of invasive plant species; zoological evaluation, and microbiological evaluation focusing on soil development.


D3.3 Assessment of rehabilitation techniques for waste heaps
The lessons relevant to RECOVERY from the assessment of rehabilitation techniques for waste heaps can be summarised as follows:
- Water and soil analyses allow estimating the contribution of the waste heaps to water and soil characteristics in order to design remediation measures, if necessary in the case of water, and to determine the predominant soil types (soil forming substrate) together with the anomalous metal concentrations.
- Above-ground vegetation comparative assessments, including, when necessary phytocenological evaluation, evaluation of the occurrence of rare and endangered plant species, and occurrence of invasive plant species, according to the different reclamation techniques, allow evaluating the individual ecological factors that affect both the reclamation methods used and the subsequent development of vegetation.
- Finally, the evaluation of a zoological evaluation (species composition, focusing mainly on invertebrate species, rare and endangered species) and a microbiological evaluation focusing on soil development can help complement the understanding of the biological characteristics of the area, as well as understanding the response to the environmental stress, more precisely disturbance, which leads to a dislocation of ecological balances.
7.- Assessment of scenarios
Taking into account the recommendations for future planning and development of the post-mining landscape from the blueprint instrument/indicator, as well as the need to improve socio-economic outcomes and to catalyse the development of new jobs, different types of land rehabilitation and ecosystem restoration actions were considered in order to generate different scenarios:
- Recolonisation of the site by local vegetation.
- Commercial forestry plantations.
- Secondary forests using local plant species.
- Development for agriculture: arable land and pastures.
- Leisure and recreational purposes: museums and recreation areas.
- Areas for physical recreation.
- Space for wildlife and nature conservation.
- Development of artificial water bodies, e.g., lakes, reservoirs, streams, etc.
- Renewable energy generation: photovoltaic and wind power.
- Industrial areas and business facilities
- Residential areas, etc.
Particular emphasis was given to consultation of scenarios with stakeholders (local authorities, neighbourhood associations, the coal mining industry, trade unions, and environmental NGOs) to guarantee the success of the whole process. The consultation took place via the Project’s webpage Consultation area or via the development of specific surveys.
The Smic Prob-Expert tool was used in some cases to facilitate the scenario selection. The Smic Prob-Expert tool is a cross-impact probability method that aims to define simple and conditional probabilities of hypotheses and events and the probabilities of combinations of the latter, taking into account interactions between events or hypotheses. The goal of this method is to tease out the most plausible scenarios for decision-makers and examine combinations of hypotheses that one would have initially excluded.
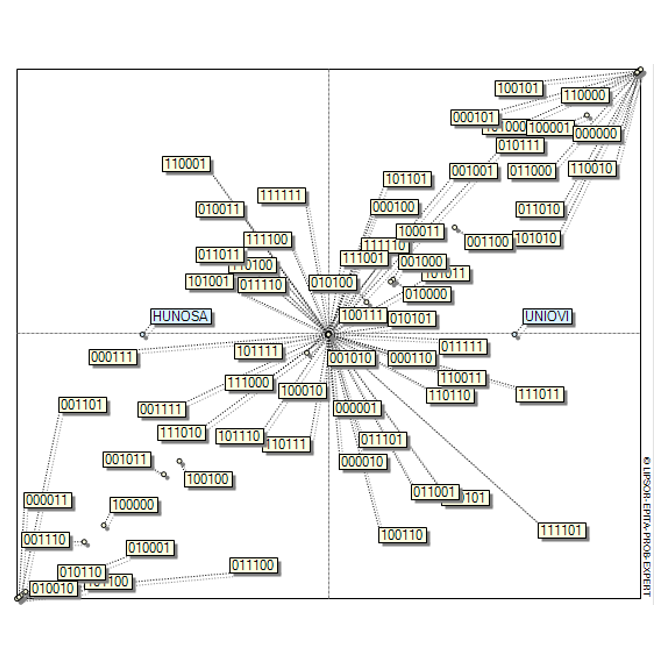
In other cases, local circumstances and long-term development of the considered landscape were used to facilitate the scenario selection.
Once the scenarios to be analysed were selected, a narrative for each of them was developed according to stakeholders’ opinions, including an overall vision for the new post-mining region and some clear targets: km2 of a recreation area, water protection area, or km2 of new forest planted, or nature conservation goals, etc.
After, narratives were translated into change rules, procedures and conditions for CLC land use classes using the if-then-else mode. Finally, after running the change algorithms, a map per scenario was developed in order to expand the GIS web interface.
D3.4 Assessment of scenarios for Figaredo Mine
D3.5 Assessment of scenarios for Janina Mine
D3.6 Assessment of scenarios for Ema Terezie complex
D3.7 Assessment of scenarios for Chabařovice and Most-Ležáky Mine
The lessons relevant to RECOVERY from the assessment of scenarios can be summarised as follows:
- Although particular emphasis was given to consultation with stakeholders (local authorities, neighbourhood associations, coal mining industry, trade unions, and environmental NGOs) to guarantee the success of the whole process, in some cases, it was difficult to achieve great involvement of the stakeholders despite the efforts made by the partners.
- Introducing the opinion of stakeholders in the Smic Prob-Expert tool was not feasible in most cases due to the statistical knowledge needed to feed the software. Just in one case, it was feasible to support them within all the processes. Nevertheless, stakeholders’ opinion was always considered in order to select the different alternatives or hypothesis to be analysed.
- Finally, the results of the stakeholder survey questionnaire showed that knowledge of the ecosystem services concept is not widespread and that the assessment of revitalisation actions to deliver ecosystem services based on expert opinion might yield different results than the assessment based on stakeholders’ opinions.
8.- Suitable indiators
Suitable indicators that will allow a proper quantification of every ecosystem service involved in the coal-mining affected areas were selected at this stage. Indicators of ecosystem services are scientific constructs that use quantitative data to measure ecosystems condition and human well-being. Properly constituted, indicators can convey relevant information for the whole process.
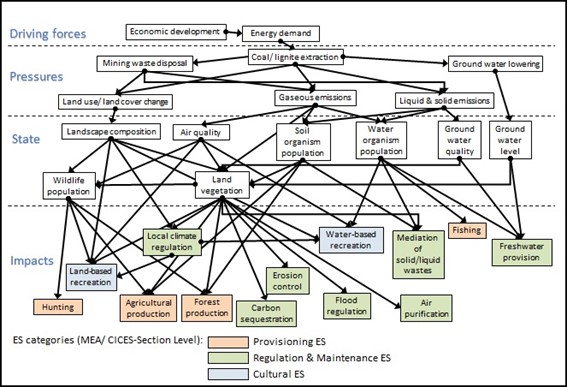
To ensure the suitability of the ES indicators used in the Recovery project, causal chains for each indicator were developed. The causal chains address key properties of ecosystem services and related issues such as pressures, state impacts and responses, informing about cause-effect relationships as well as reflecting the relevance for mining and post-mining landscapes. An established and widely used causal chain approach was used: the Driving Forces-Pressures-State-Impact-Response (DPSIR) framework, developed by the European Environmental Agency.
The causal network approach provides a way to reflect the linkages between the driving forces, pressures, states, impacts and responses by showing the interactions between the several different components across each category of the DPSIR framework. The causal network thus improves the process of selecting indicators by providing decision support based on the cause-effect relation of each indicator in the causal network. The causal network approach also provides a better knowledge base for the planning of responses. The approach allows considering the effects of changes in the driving forces, policy interventions, or behavioural changes in the causal network, taking possible positive and negative feedback between changes of the multiple driving forces, pressures, and states into account.
The lessons relevant to RECOVERY from the selection of suitable indicators can be summarised as follows:
- With the relevant factor for the predominant land use determined by geological potentials and not by land cover, these landscapes have the coal mining activities as a common feature, while the other landscape attributes, in particular the ecosystems that constitute the land cover and landscape functions, may vary considerably between mining landscapes.
- During the indicators selection process, the list of ES is not study site-specific. It rather represents a framework to be adopted for coal mining sites, regardless of whether the mining action takes place aboveground or underground. With some minor adjustments, the framework can also be used for ore mining and quarrying, adding additional value to the developed indicators selection approach.
- Comparison between case studies in the project will be possible, taking into consideration ES indicators such as water runoff, air pollution, thermal emissivity, and other indicators related to the impact of coal mining. The comparison has to be reflected in the light of differences in the type (above/underground) and the scale of mining (large scale/small scale), and other landscape conditions such as climate, geomorphology or hydrology. However, in terms of recovery of landscape functions or replacement or creation of new landscape functions following the mining, the different study sites are comparable. This comparison can be based on the benefits derived from the ES and uses the assessment of ES based on the suitable indicators for each study site, and a valuation of the benefits using feasible valuation techniques.
9.- Feasible valuation techniques
A new valuation methodology for non‐provisioning ecosystem services is developed, as evidence was found regarding the lack of homogeneity caused by the existing approaches. Using different valuation methods for non‐provisioning ecosystem services generates a lack of uniformity in the valuation process that Multicriteria decision analysis can hardly correct.
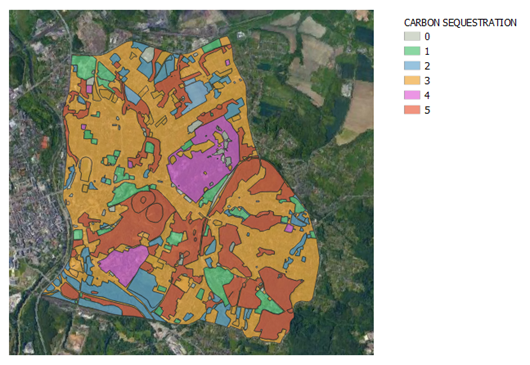
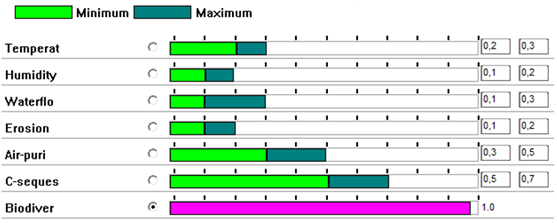
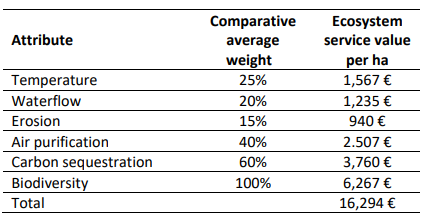
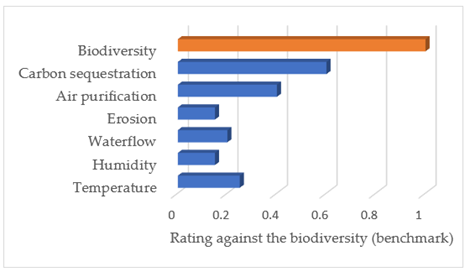
In the first place, non‐provisioning ecosystem services were quantified before their monetisation using tables of coefficients for each land cover type derived from field experiments. Then, they were transformed into a common metric, an index between one and ten, through local scaling. Local scaling sets upper and lower bounds using locally measured performance values instead of global scales that may cause irrelevance of differences between local measures.
In the second place, to monetise non‐provisioning ecosystem services, the implementation of techniques based on the propagation of imprecise preference statements in hierarchical weighting was used. Once a reference attribute has been selected, the remaining attributes are compared to the reference, considering the specific environment and the local scale used.
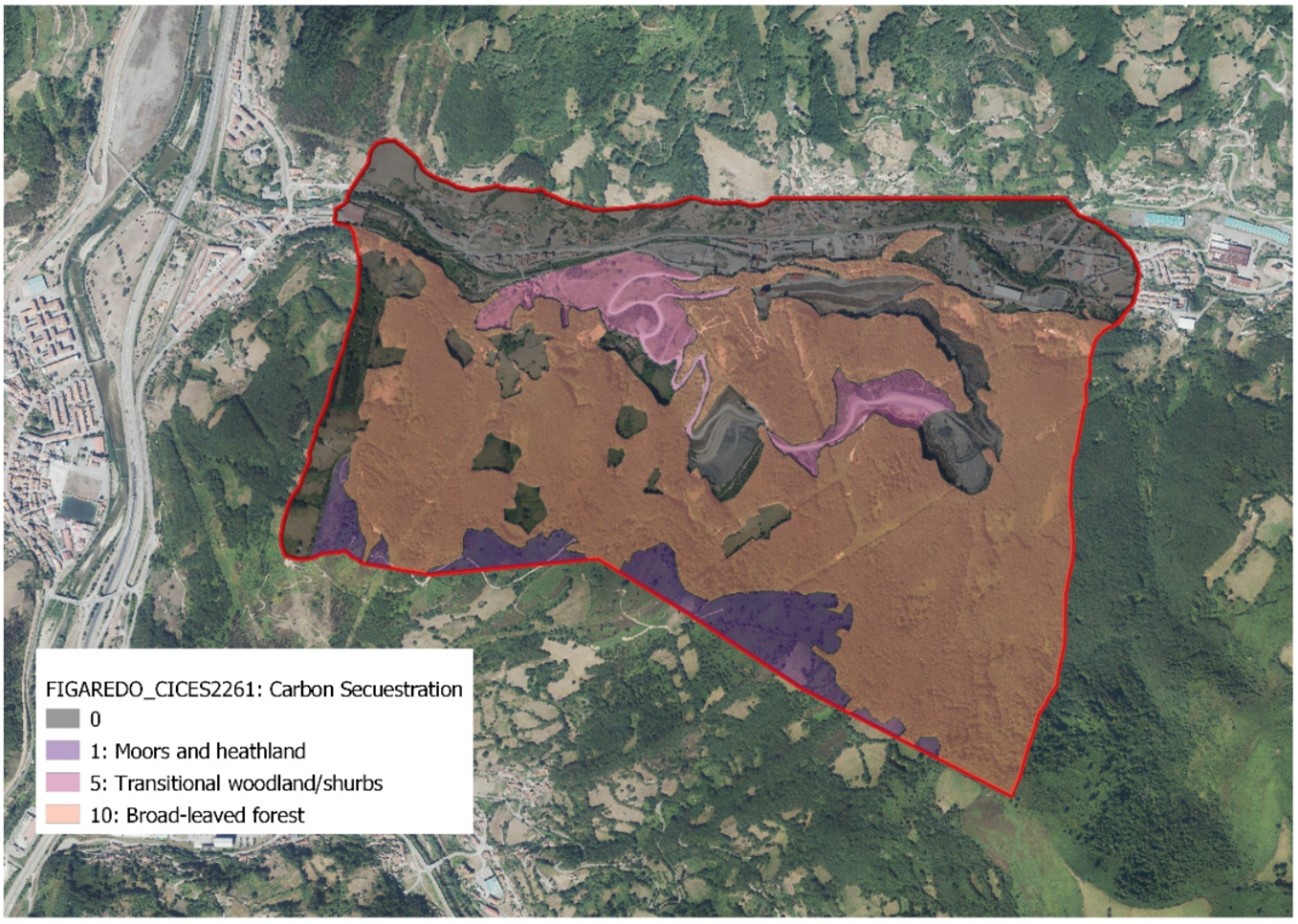
Finally, and to achieve consistency, monetisation of all non‐provisioning ecosystem services will build on the above comparison and the monetary valuation of the attribute with the most direct and market‐related valuation possible: carbon sequestration, which was valuated using the EU Emissions Trading System.
D4.2 Feasible valuation techniques
The lessons relevant to RECOVERY from the valuation of non-provisioning ecosystem services can be summarised as follows:
- Multi-criteria decision analysis was developed to determine the best choice based on the scores of different criteria and the relative weights given to those criteria. However, it is complicated to assign relative weights to criteria that have been evaluated with varying assessment methods.
- Non-provisioning ecosystem services have to be quantified in the first place using tables of coefficients for each land cover type derived from field experiments. Then, they will be transformed into a standard metric employing local scaling instead of global scales that may cause irrelevance differences between local measures.
- The source of uncertainty in these valuations will be the different values in different climatic environments/conditions and assumptions based on specific areas or circumstances.
- Then, the implementation of techniques based on the propagation of imprecise preference statements in hierarchical weighting may be used, with a reference attribute having to be selected to compare the remaining attributes. Biodiversity was selected as, of all the attributes, it was the one that allowed comparisons to be made with the others in the most obvious way.
- Finally, monetisation of all non-provisioning ecosystem services should be built on the above comparison and the monetary valuation of the attribute with the most direct and market-related valuation possible: carbon sequestration using the EU Emissions Trading System.
- As the average value of EU Allowances during 2019 and 2020 was used, variation in the value may change the results. This question will be discussed later.
10.- Adequate discount rates
In this deliverable, the appropriate discount rates to undergo the valuation of provisioning ecosystem services, including the costs incurred for developing them and the expenses needed to create non-provisioning ecosystem services, are proposed.
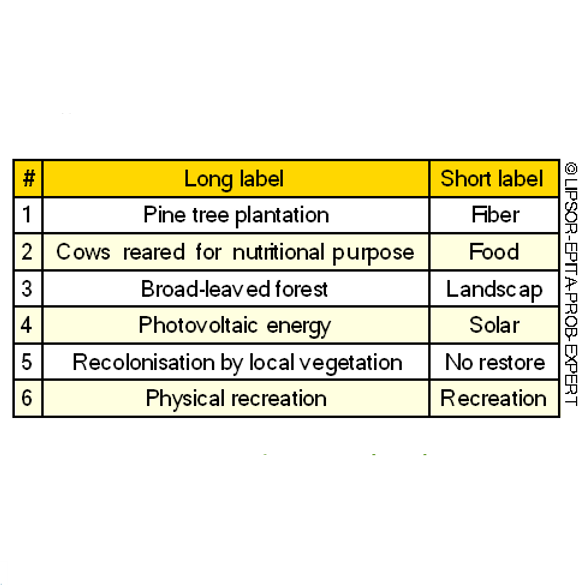
For this purpose, three different categories of goods were distinguished: (1) non-intensive natural goods production, such as familiar animal exploitation, familiar tree plantations, familiar agriculture, etc.; (2) intensive natural goods production, such as intensive animal farms, intensive forest exploitation, intensive agriculture, etc.; and (3) industrial goods production such as renewable energy production, industrial facilities, etc.
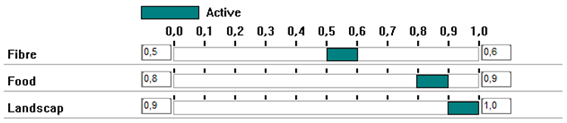
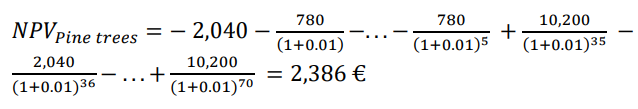
The proposed discount rates were then used in the Figaredo mining area case study and applied to calculate the value of two provisioning ecosystem services: fibre production, which refers to pine plantations producing wood as raw material, and food production, which relates to cows reared for feed. Also, the actual costs of a non-provisioning ecosystem service, broad-leaved forest, were estimated.
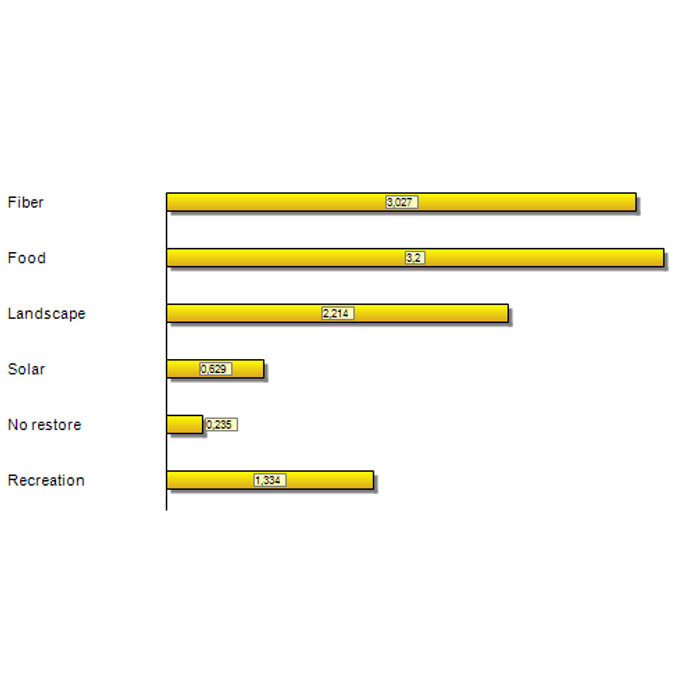
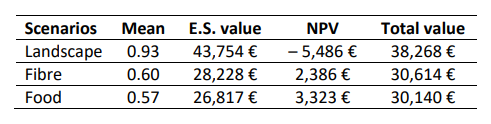
After, the revenues of the three scenarios considered feasible for the Figaredo mining area (Fibre, Food and Landscape) were determined using the values of the non-provisioning ecosystem services previously calculated.
Finally, an exercise was carried out to estimate what the price of EU Allowances would have to be for the Landscape scenario to be chosen, being tantamount to allowing nature itself to set the price of EU Allowances in the Figaredo mine environment.
The lessons relevant to RECOVERY from the selection of the adequate discount rates can be summarised as follows:
- Real/constant discount rates should be used in the calculations, as it will be challenging to consider adequate variations of the inflation rate over 70 years or more. Moreover, real/constant rates will allow using a common language despite the usual economic differences among European countries.
- Non-intensive natural goods production, such as familiar animal exploitation, familiar tree plantations, familiar agriculture, etc., are proposed to be valued at a real/ constant rate of 1%, which is equivalent to the average reference rate of the European mortgage market in 2020.
- Intensive natural goods production, such as intensive animal farms, intensive forest exploitation, intensive agriculture, etc., are proposed to be valued at a real/constant discount rate of 3%-3.5%.
- Industrial goods production, such as renewable energy production and industrial facilities, are proposed to be valued at a real/constant discount rate of around 6.0%-7.0% as there is usually an external investment trying to achieve capital returns.
- The values proposed for discounting industrial goods production should be accepted only when the industrial goods production risk can be considered average. In case the risk is over average, the discount rate should increase in the same proportion.
- When the difference in the valuation between several scenarios is negligible, the selection between them should be based on the ease of undertaking, measured in the lower investment needed to realise the scenario.
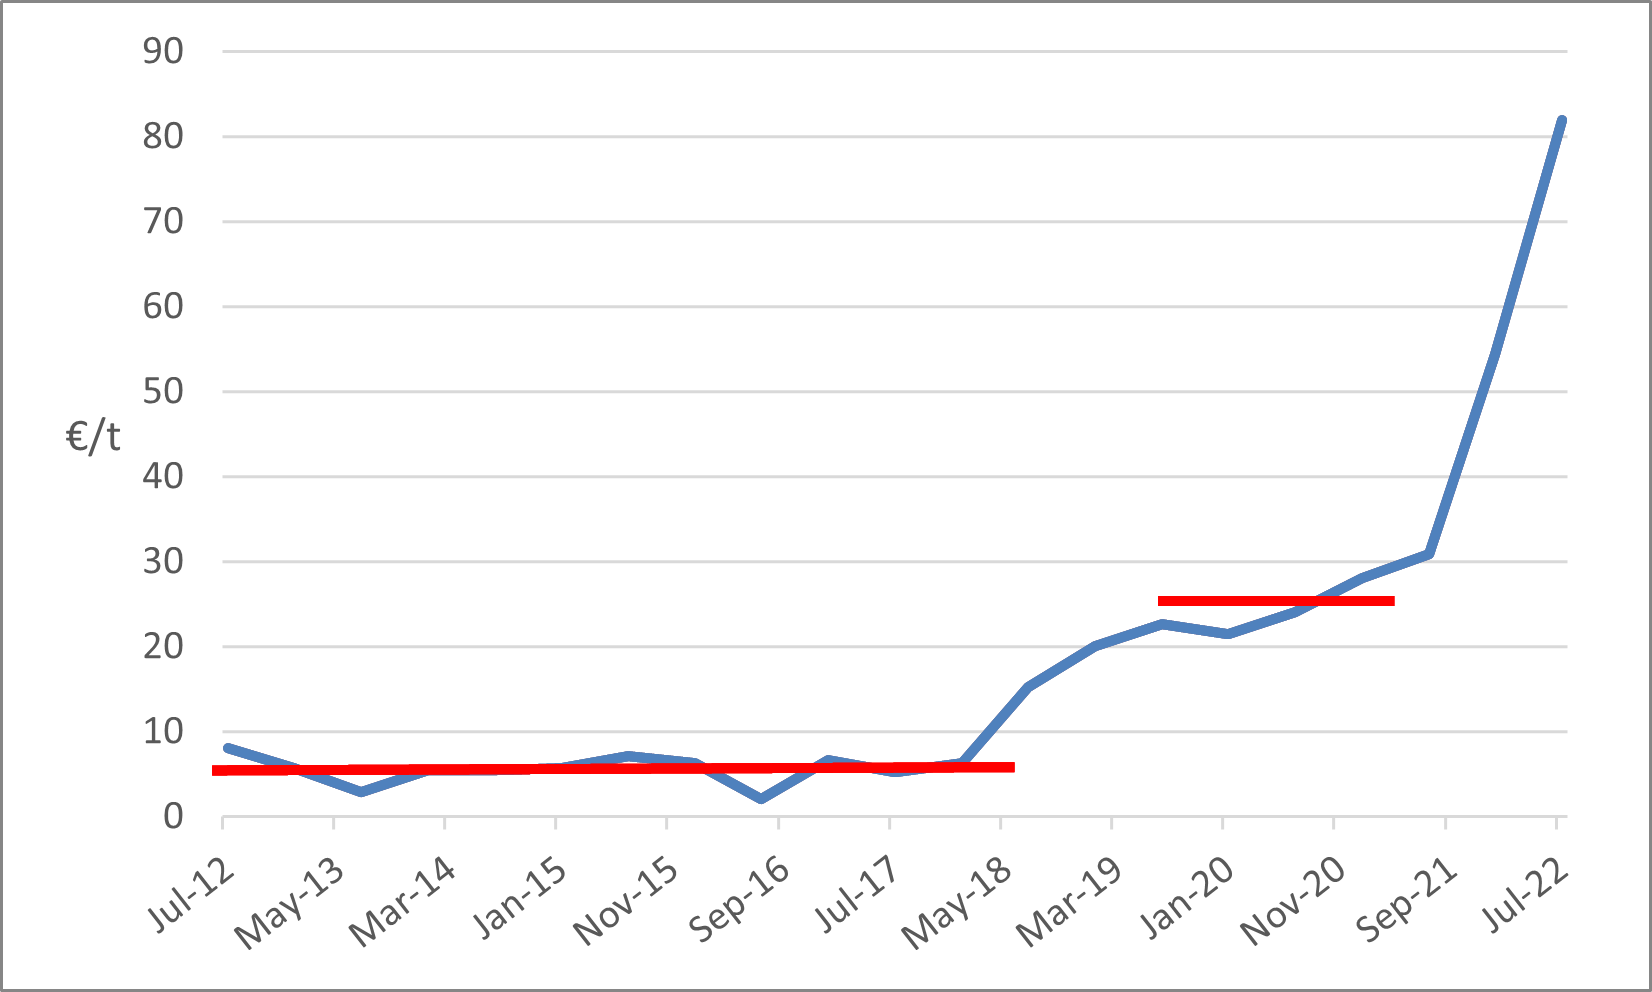
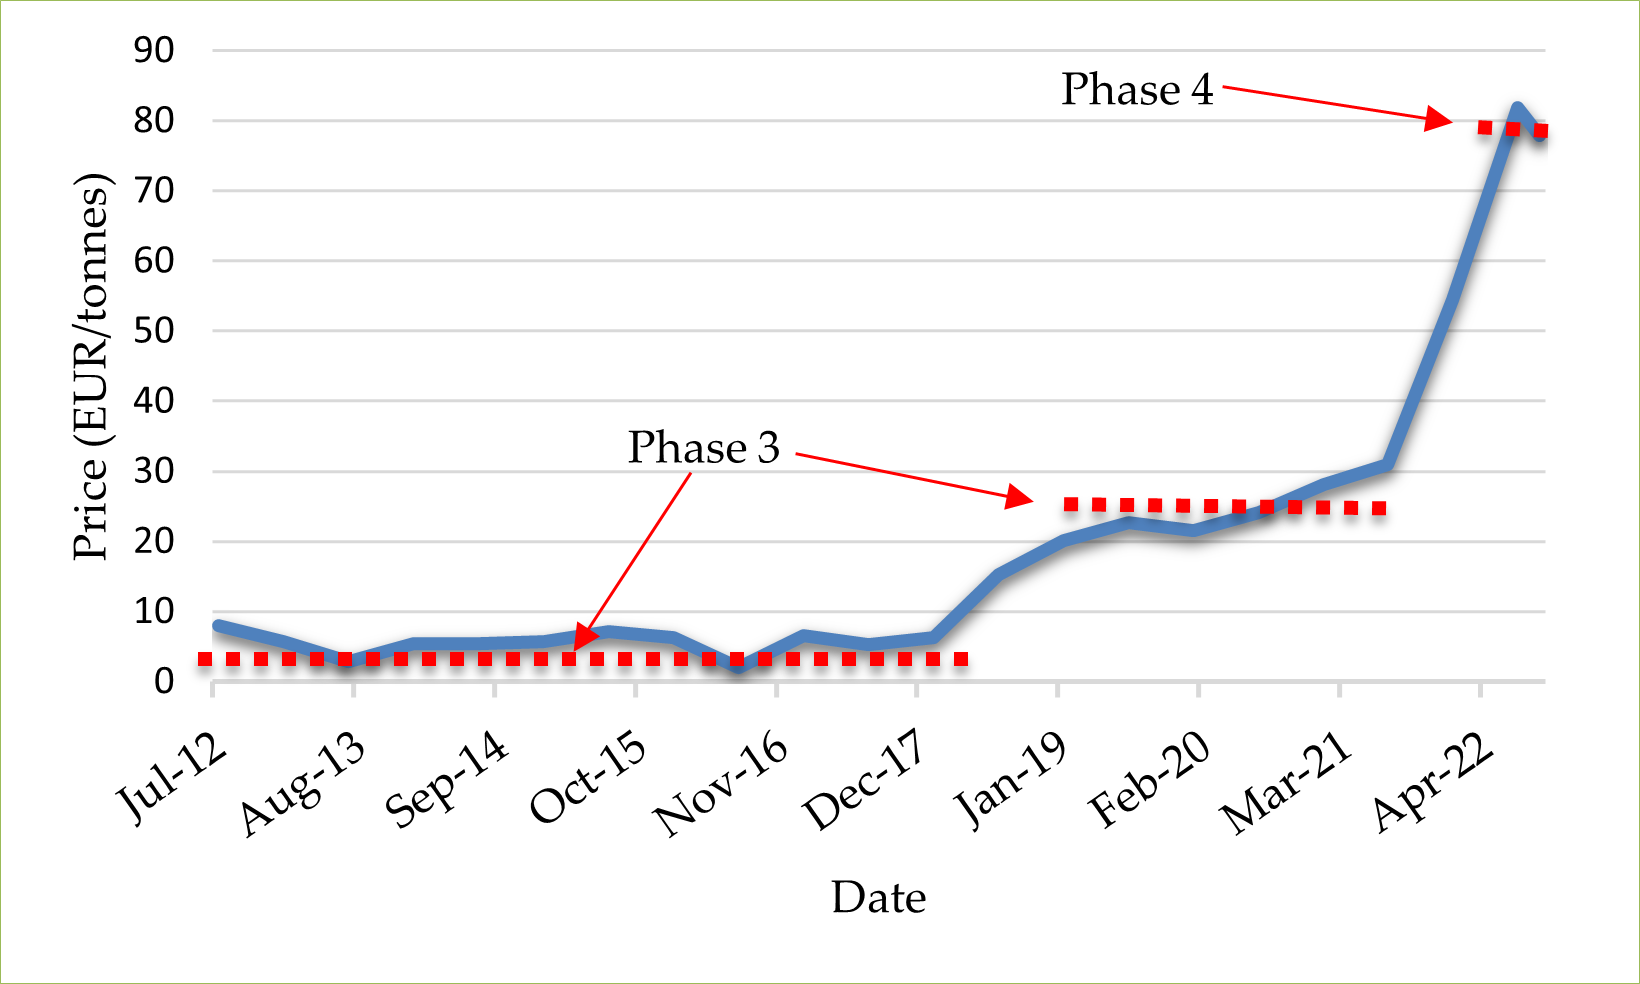
- The price of EU carbon permits varies over time, so in the valuation, it was used the average value during 2019 and 2020, which was relatively stable and coincident with phase 3 of the allocation of allowances. After the price escalation that coincides with phase 4 of the allocation of allowances under the EU Emissions Trading System that takes place from 1 January 2021, the consideration changed and, although not stable yet, it allowed to estimate this carbon price by prioritising biodiversity over the rest of scenarios, something that was never done before.
11.- Relevant market price data
The relevant market prices for the scenarios considered for Figaredo Mine in Spain, Janina Mine in Poland, and Ema-Terezie in the Czech Republic, were specified and collected. Most-Ležáky Mine and Chabařovice Mine in the Czech Republic do not expect benefits in their foreseen scenarios.
When necessary, the areas involved in the market prices (in ha) and the total market prices are also presented in the Deliverable, together with the shares of Corinne Land Cover (CLC) classes in each scenario.
Prices of EU emission allowances were also collected and analysed. To achieve consistency, the monetisation of all non-provisioning ecosystem services will build on the monetary valuation of the attribute with the most direct and market-related valuation possible: carbon sequestration, which will be evaluated using the EU Emissions Trading System, the world’s first primary carbon market. The EU Emissions Trading Scheme (EU ETS) is the first primary carbon market in the world and the largest. The EU ETS was introduced in 2005 and has reduced emissions by around 43% in the sectors covered by emissions trading.
D5.1 Relevant market price data
The lessons relevant to RECOVERY from the collection of market prices can be summarised as follows:
- In several cases, finding a data source to quantify the ecosystem services was not possible, so specific research had to be developed in the region to estimate market prices.
- The sources of uncertainty in many valuations are derived from the changing market prices as a function of demand/supply and their elasticity.
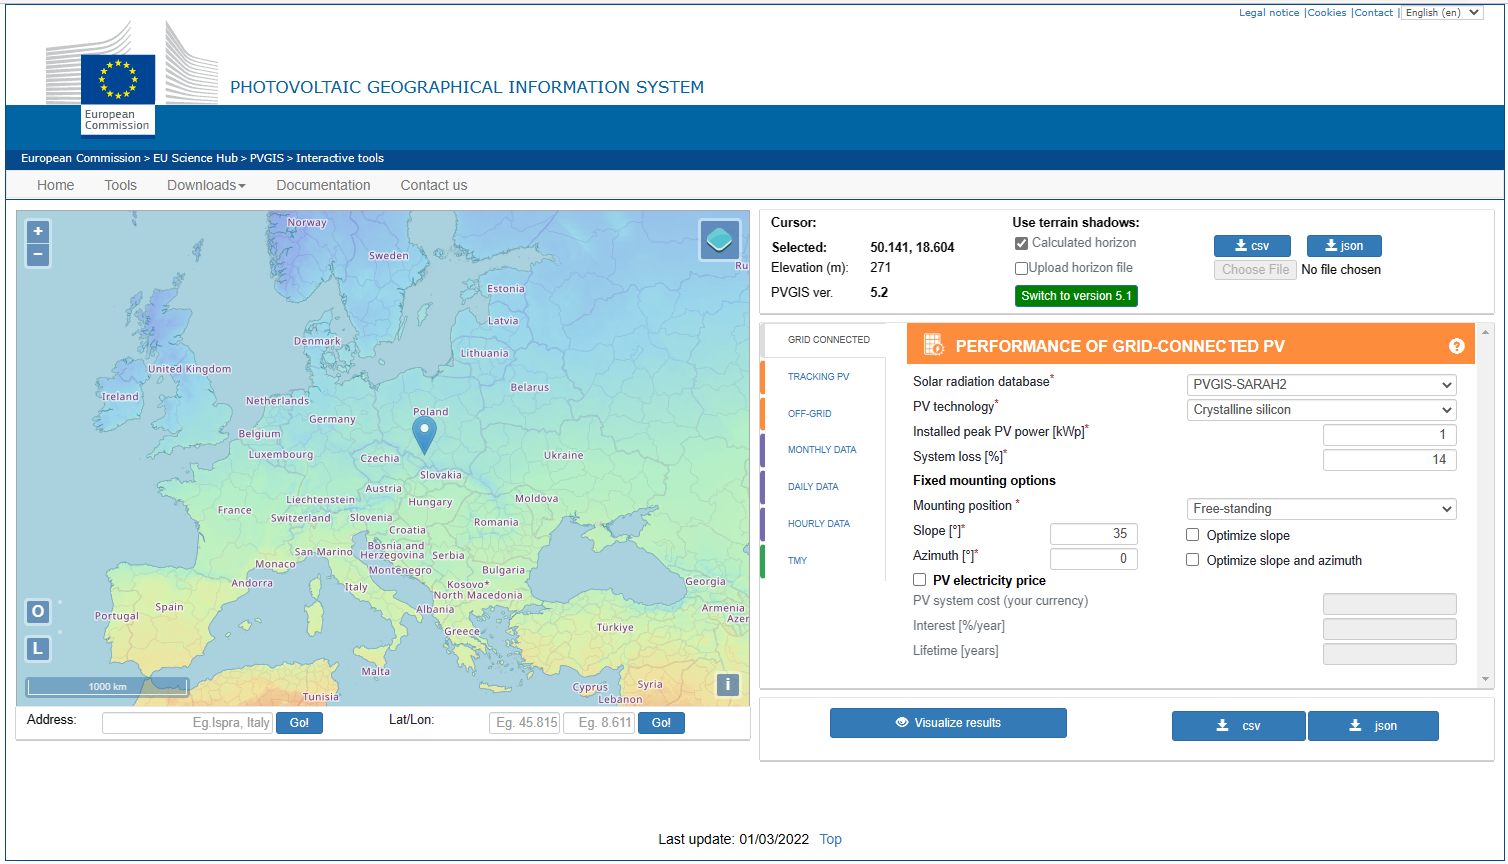
- For estimating the solar energy generated by photovoltaic panels, the Photovoltaic Geographical Information System from the European Commission (https://re.jrc.ec.europa.eu/pvg_tools/en/tools.html) is a perfect tool.
- EU carbon permit prices depend on the implementation phases of the EU Emissions Trading Scheme (EU ETS). Thus, the monetisation of non-provisioning ecosystem services should consider this fact.
12.- Investment and maintenance costs
The investment and maintenance costs for the different scenarios considered for the five case studies (Figaredo Mine in Spain, Janina Mine in Poland, and Ema-Terezie, Most-Ležáky Mine and Chabařovice Mine in the Czech Republic) were specified, collected and calculated.
Special attention was also given to the sunk costs, which are necessary regardless of the scenario selected. These costs were collected to inform the different stakeholders about all the costs involved in the restoration process, not only the ones related to the specific development of foreseen scenarios.
Both investment and maintenance costs are presented in EUR/m2 and EUR/ha to facilitate their comprehension. When necessary, the areas involved in the costs (in ha) and the total costs are also presented, together with the shares of Corinne Land Cover (CLC) classes in each scenario.
D5.2 Investment and maintenance costs
The lessons relevant to RECOVERY from the collection of investment and maintenance costs can be summarised as follows:
- Although it is interesting to present costs in EUR/m2 and EUR/ha, in some cases, such as constructions, roads, shelters, etc., costs in EUR/m2 do not have a physical significance.
- Sunk costs are not necessary to be considered when calculating to decide which options (scenarios) will provide the most significant benefits. However, the stakeholders need to know the exact costs they will incur during the restoration process.
- It is essential to specify the precise area involved in the cost or the percentage that applies in the designed CLC to facilitate subsequent NPV calculations.
13.- Best scenario selection
The net present value (NPV) for every generated scenario was calculated to establish the net economic consequences in the ecosystem services provision and select the most interesting scenario for each case study.
First, the CLC classes involved in the assessment of scenarios and the changing rules of CLC classes for the different scenarios were presented. Also, the ecosystem services and their indicators were summarised.
Second, the quantification of non-provisioning ecosystem services was developed, selecting the quantification method and normalising the values in an index between 1 and 10.
Third, non-provisioning ecosystem services were evaluated by comparing ecosystem services with the reference attribute that, in most cases, was biodiversity. Then, to monetise the set of ecosystem services, the one for which valuation is most feasible was first selected: carbon sequestration through the EU Emissions Trading System is the most viable.
Fourth, and after valuing the non-provisioning ecosystem services for each scenario, the valuation of provisioning ecosystem services was estimated by calculating the net present value of their investment and maintenance costs and their market price data, if any.
Fifth, the total value of the different scenarios was obtained by adding the non-provisioning ecosystem service values to the net present value calculated for the provisioning ecosystem services and the investment and maintenance costs of the non-provisioning ecosystem services.
The lessons relevant to RECOVERY from the best scenario selection can be summarised as follows:
- Local scaling was the method selected to transform non-provisioning ecosystem service values into a common metric, an index between one and ten in this particular case. Local scaling sets upper and lower bounds using locally measured performance values instead of global scales that may cause irrelevance of differences between local measures. Thus, all criteria performance values will have the same influence on the final scores of the alternatives if they are weighted equally.
- To estimate the ecosystem services provision (or weight) for each proposed scenario, selecting a reference ecosystem service was necessary. Biodiversity was chosen as the reference ecosystem service because of all the ecosystem services. It was the one that allowed comparisons to be made with the others in the most obvious or intuitive way, which facilitated the development of the process. The rest of the ecosystem services were then compared with biodiversity.
- To achieve consistency, monetisation of all non-provisioning ecosystem services was carried on the above comparison and the monetary valuation of the attribute with the most direct and market-related valuation possible: carbon sequestration, using the EU Emissions Trading System.
- The price escalation coinciding with phase 4 of the allocation of allowances under the EU ETS (2015), which took place on 1 January 2021, made it necessary to adjust or rethink the ecosystem services valuation process developed. To achieve this goal, the introduction of new vectors or “missing ecosystem services” was proposed to counterbalance efforts to eliminate carbon dioxide emissions without necessarily removing humans from the equation: welfare and human health.
- As the linkages regarding ecosystem health, ecological restoration and human health are not well known, only welfare was incorporated into the framework. The results were highly satisfactory, in line with what was expected for the study region and those obtained before the price escalation of carbon allowances started in 2021.
- The valuation of the provisioning ecosystem services and the costs incurred for non-provisioning ecosystem services were done by calculating their net present value (NPV) over a sufficiently long period.
- Finally, it was possible to estimate the price of EU allowances after the price escalation that coincides with phase 4 of allowances allocation by prioritising the Landscape scenario. It is tantamount to allowing nature (biodiversity) to set the price of EU allowances in the study area to become the scenario to be chosen.