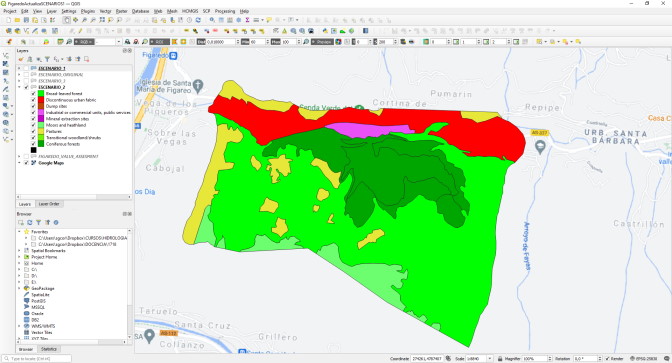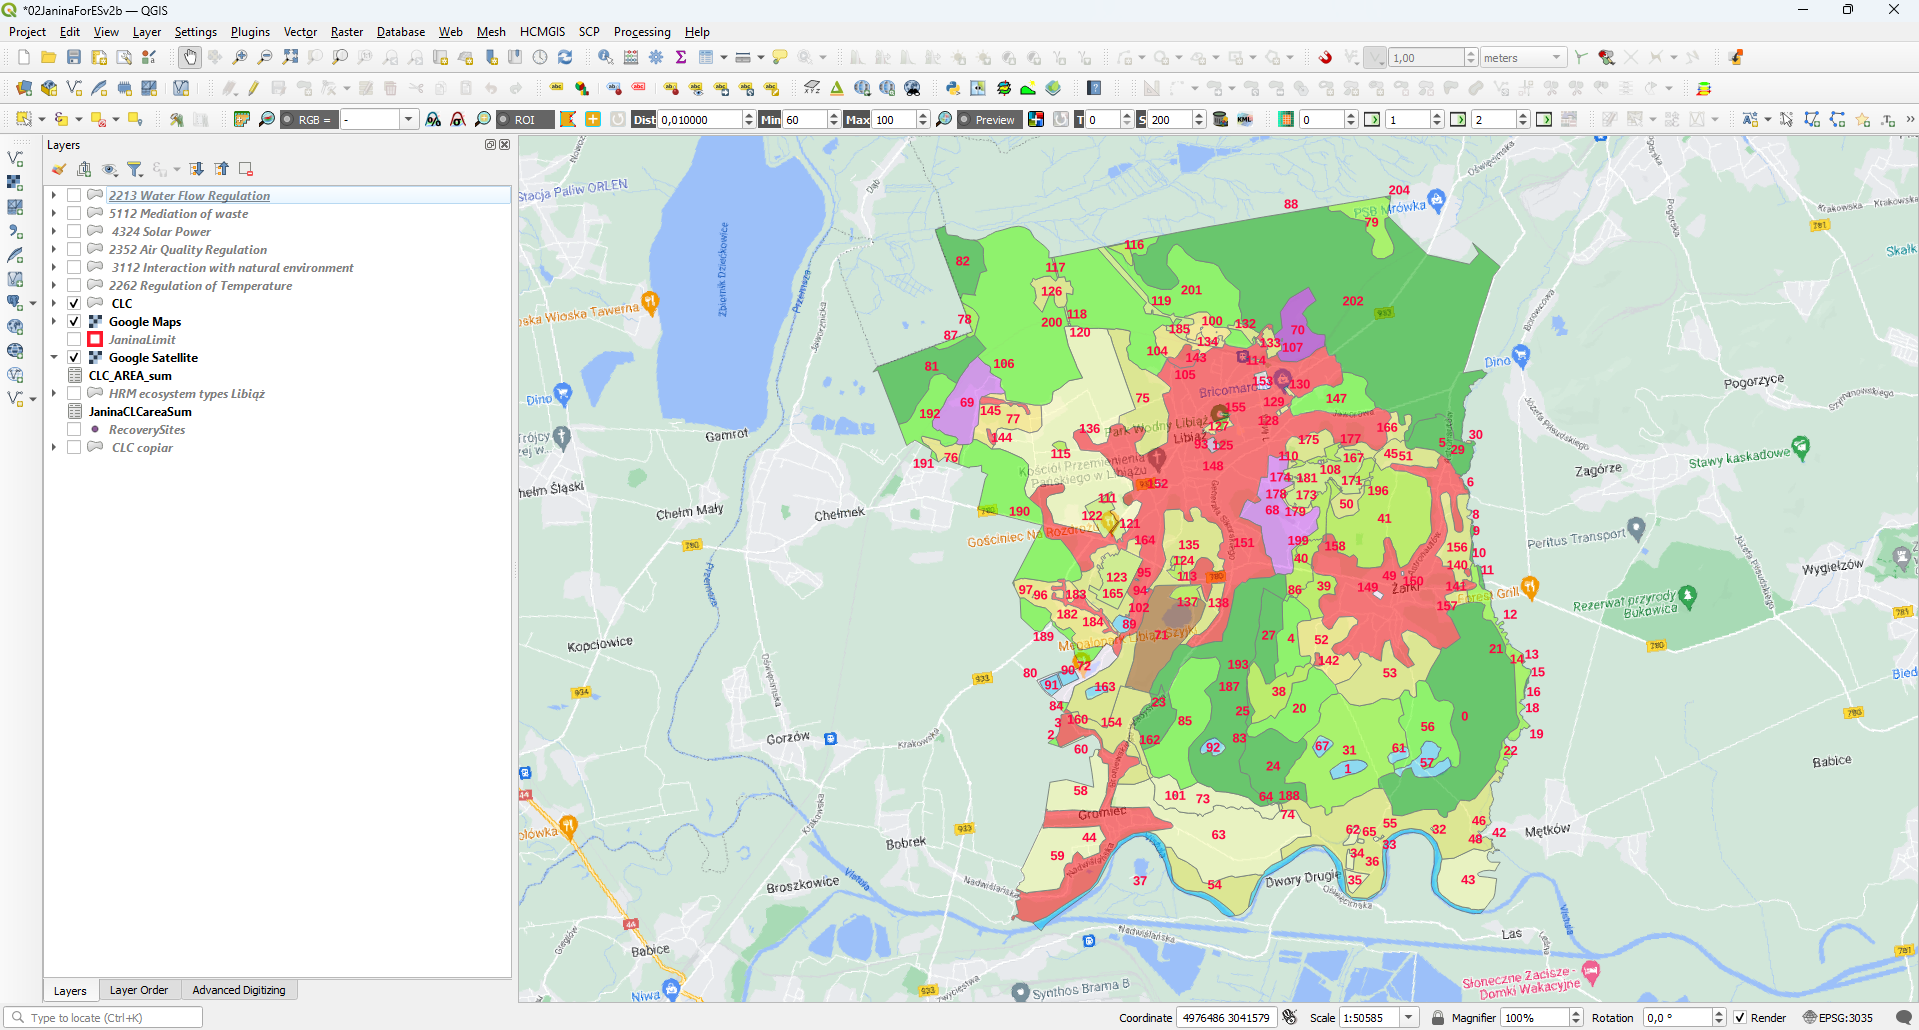
QGIS GENERATED WEBGIS
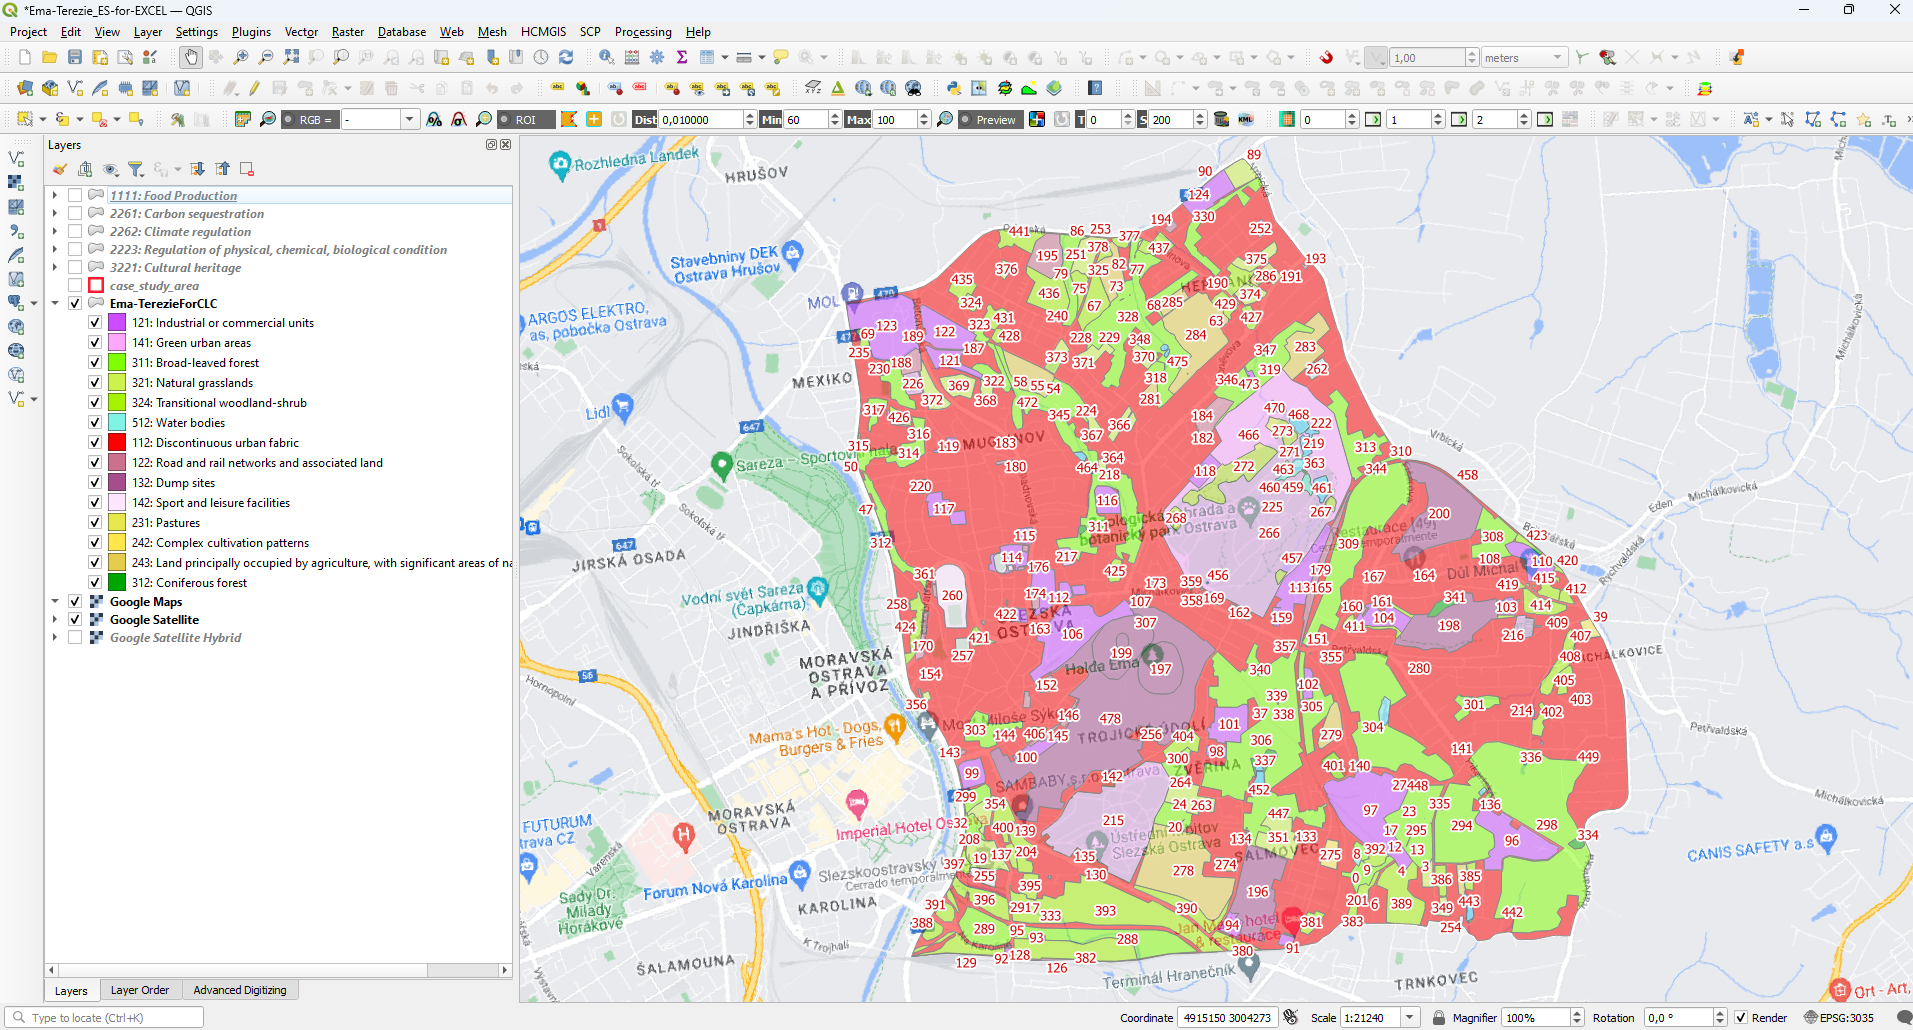
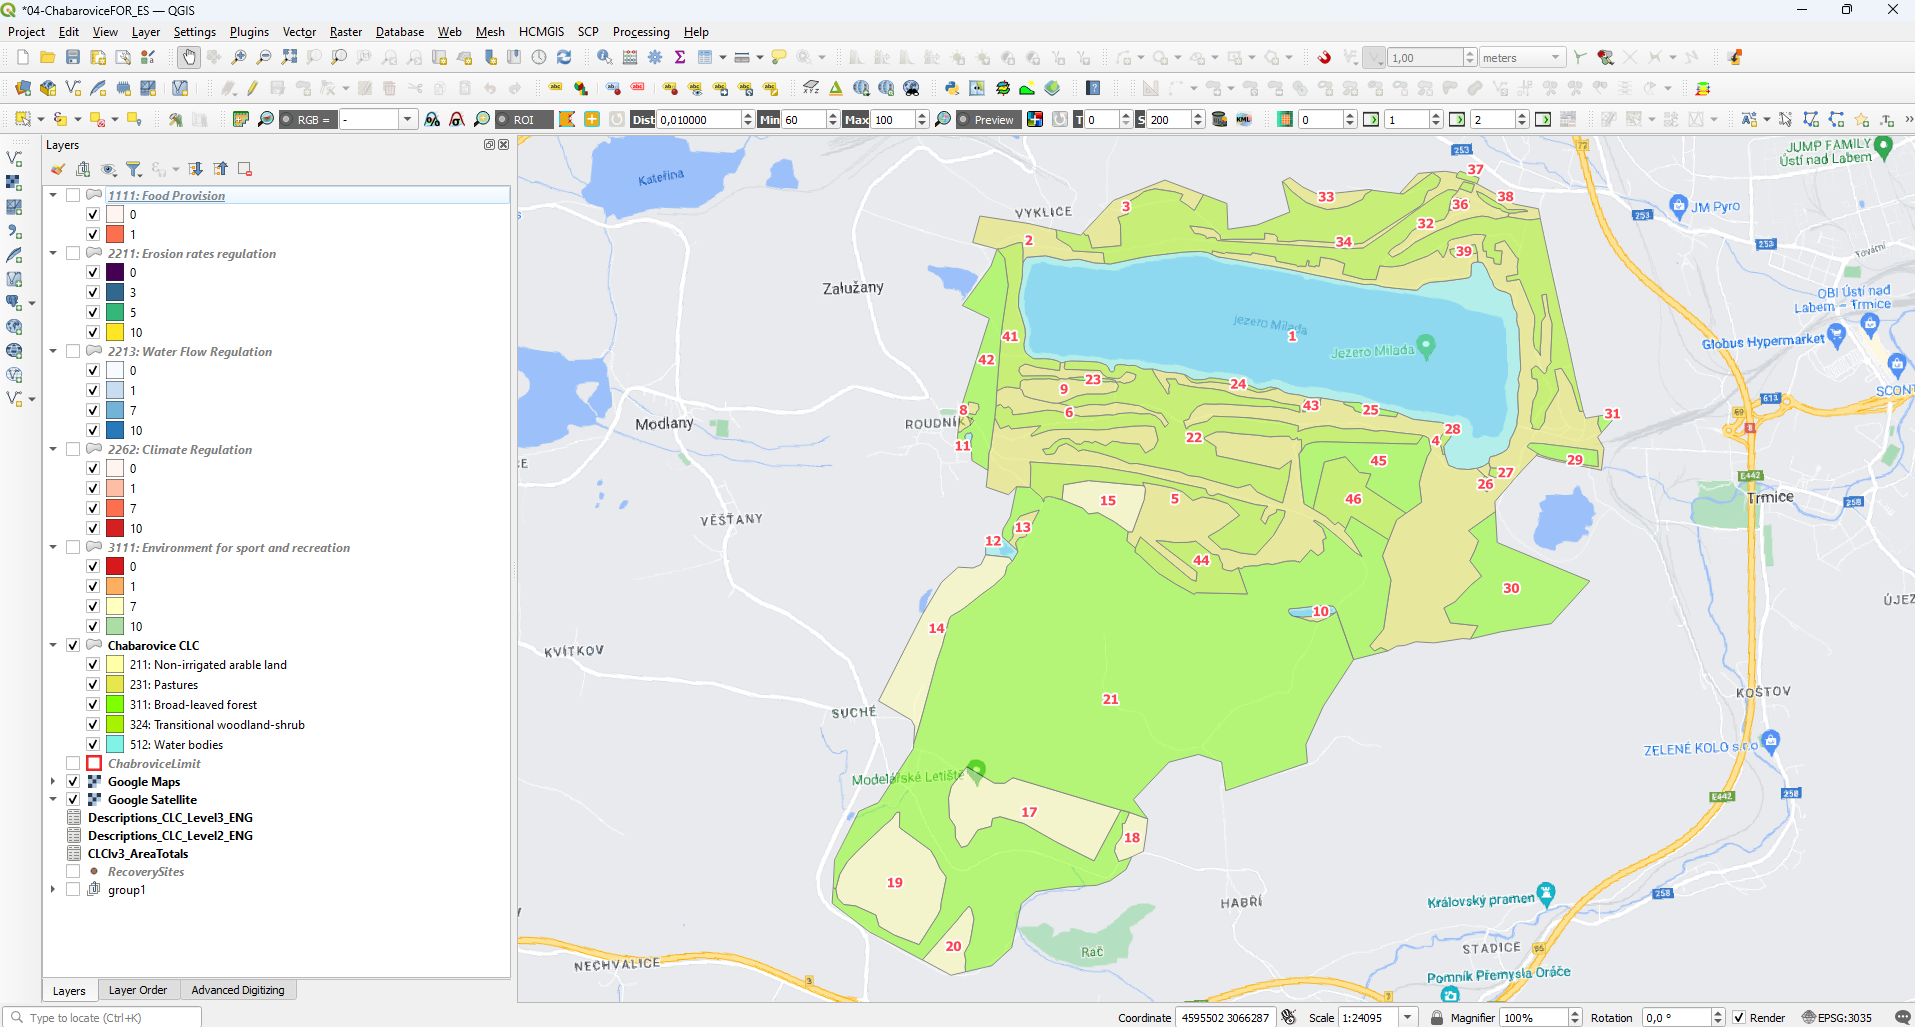
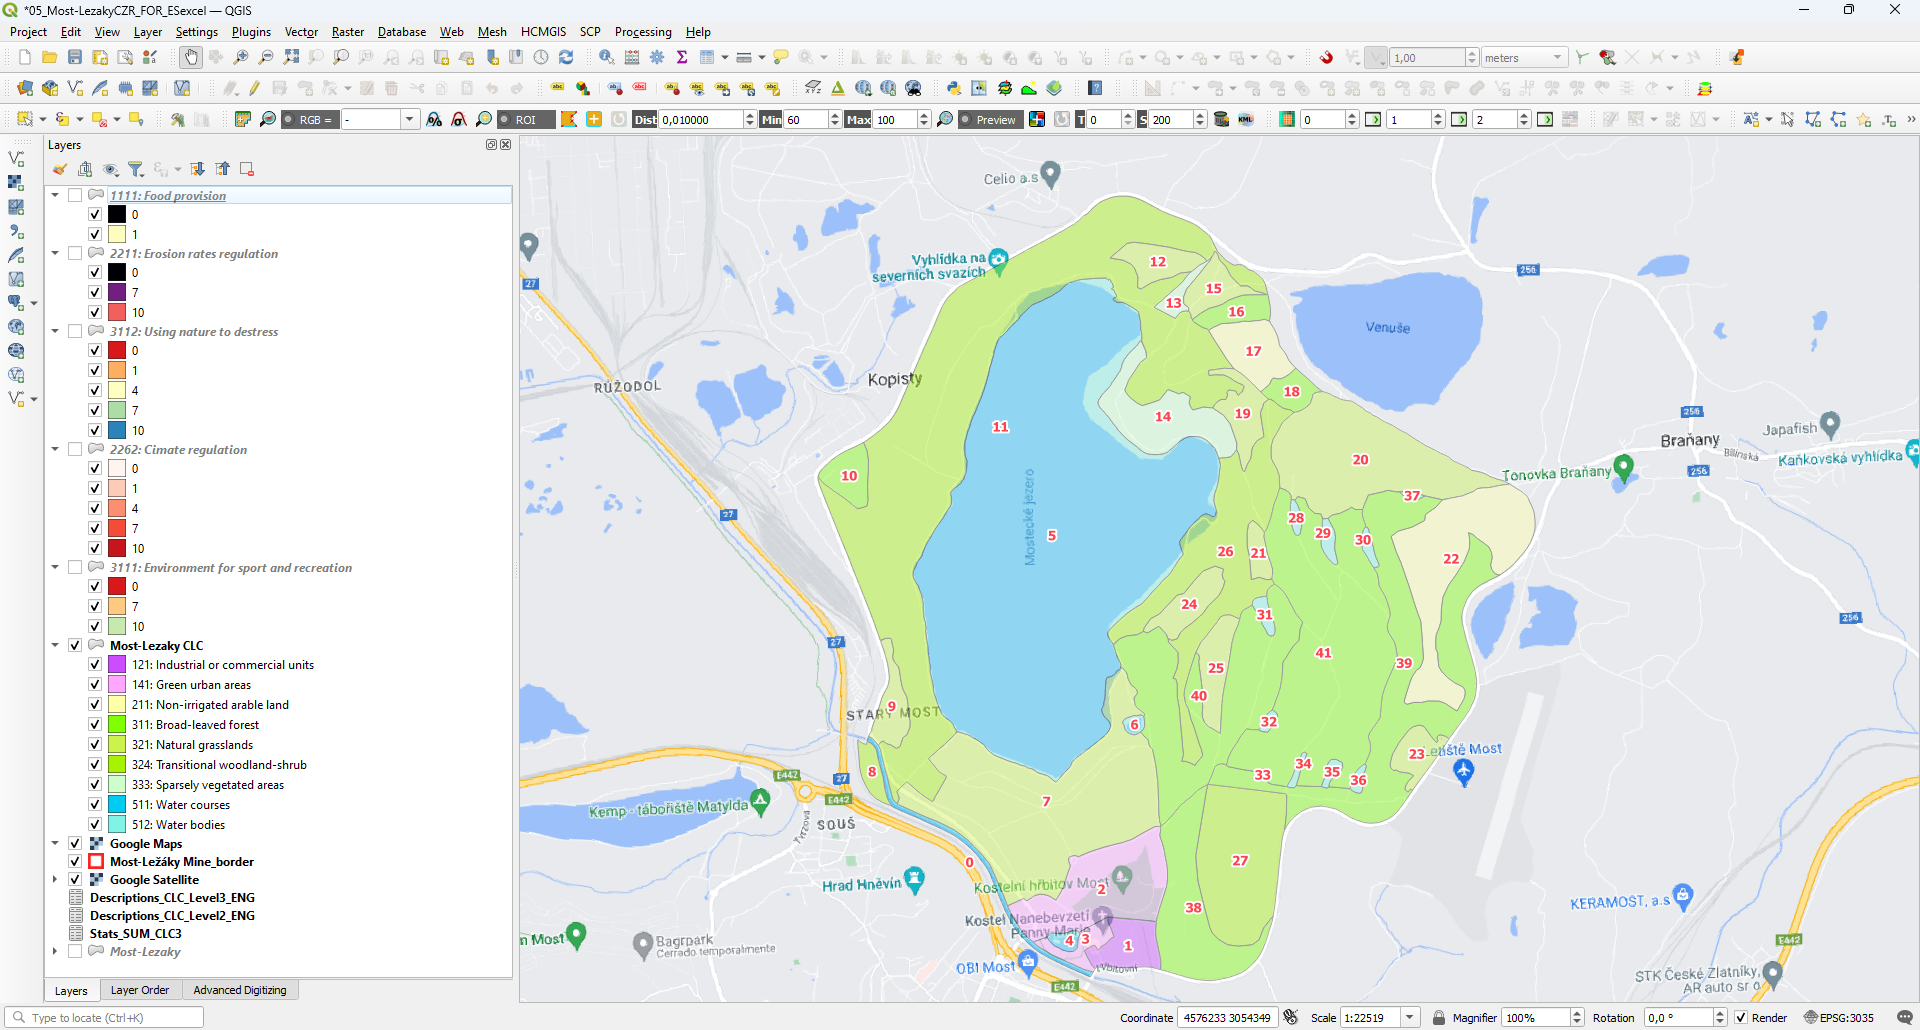
WebGIS were created using an open-source Geographic Information System (GIS), in this case “QGIS 3.16 Hannover”, where different layers were considered, such as orthoimage maps, spatial point or polygon layers like water sources and rivers, relevant land covers and relevant ecosystems.
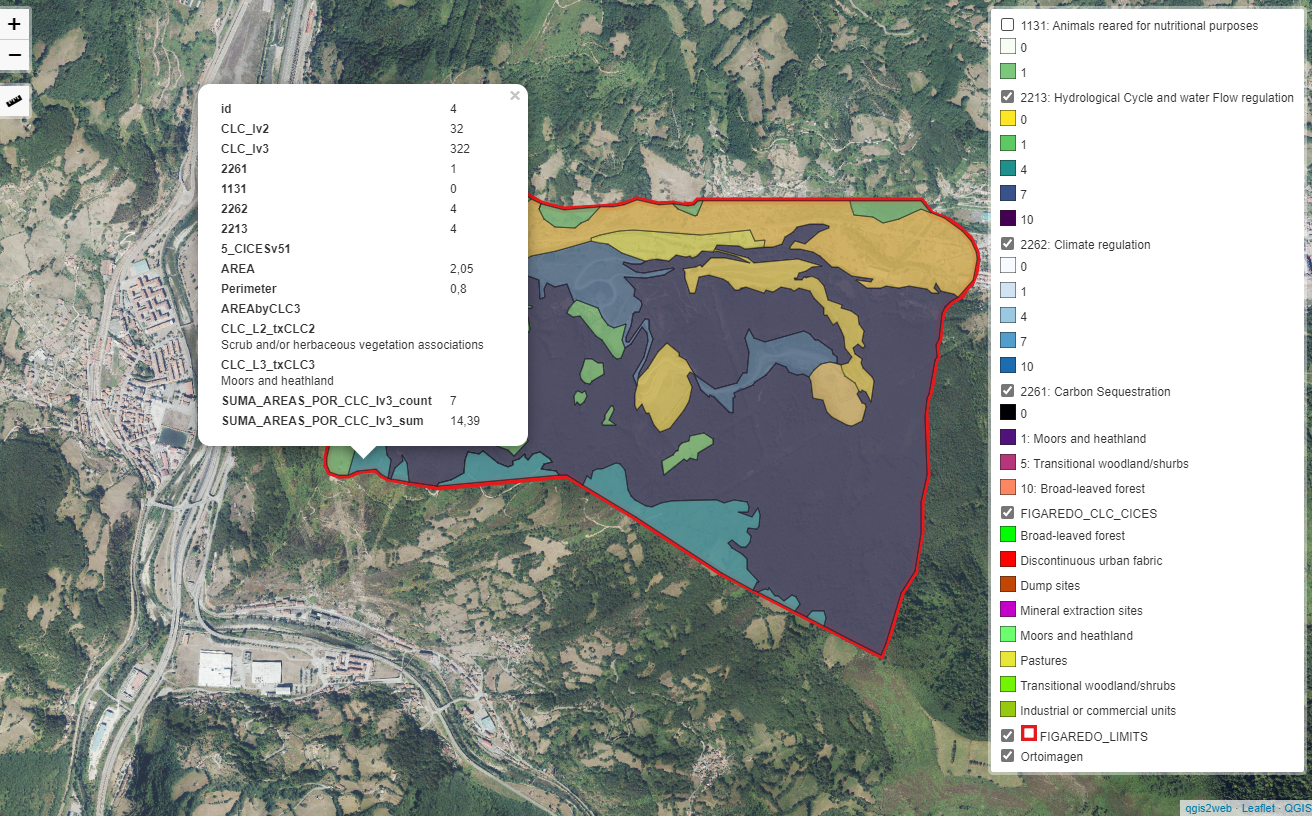
To access the different GIS, click on the name of the case-study. Then, clicking in the menu button situated in the upper right of each screen, the full menu will appear, being possible to activate or deactivate the different ecosystem services, as well as the Corine land cover, the case study limits and the orthoimage.
Also, clicking in each of the land cover areas it is possible to obtain a full description with the identification number of the area, the typology of CORINE land cover (level 2 and level 3), the representative ecosystem services in their four-digit classification according to CICES v5.1 as well as their valuation in a scale from 0 to 10. This valuation from 0 to 10 will be completed later in the project.
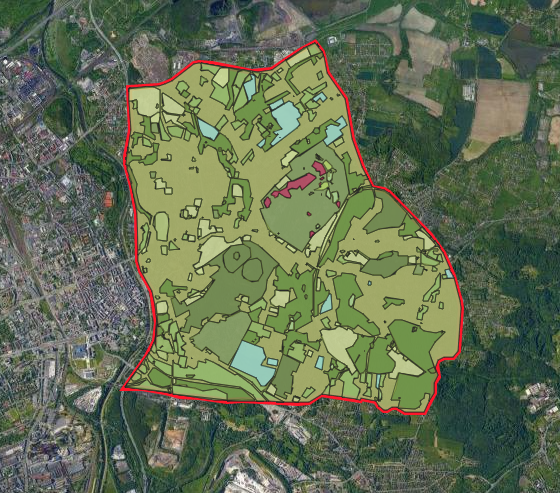
(Ostrava, Czech Republic)
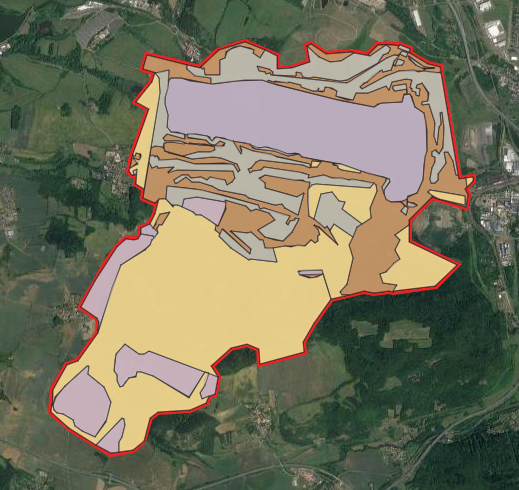
(Bohemia, Czech Republic)
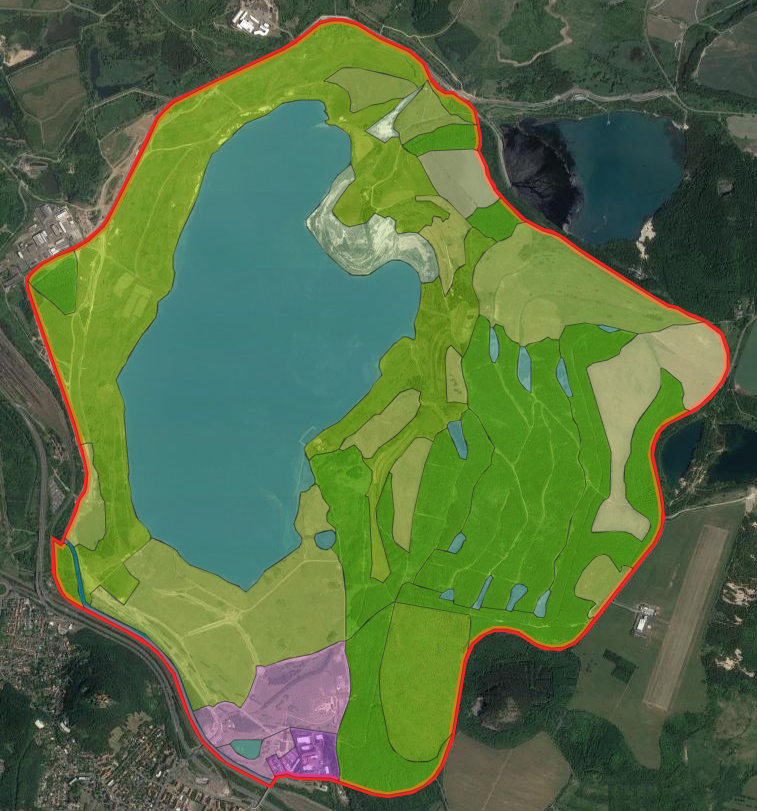
(Bohemia, Czech Republic)
The weaknesses of QGIS are extremely limited functionality, popups for each polygon, no field calculation capability, and no attribute or geometry edition.
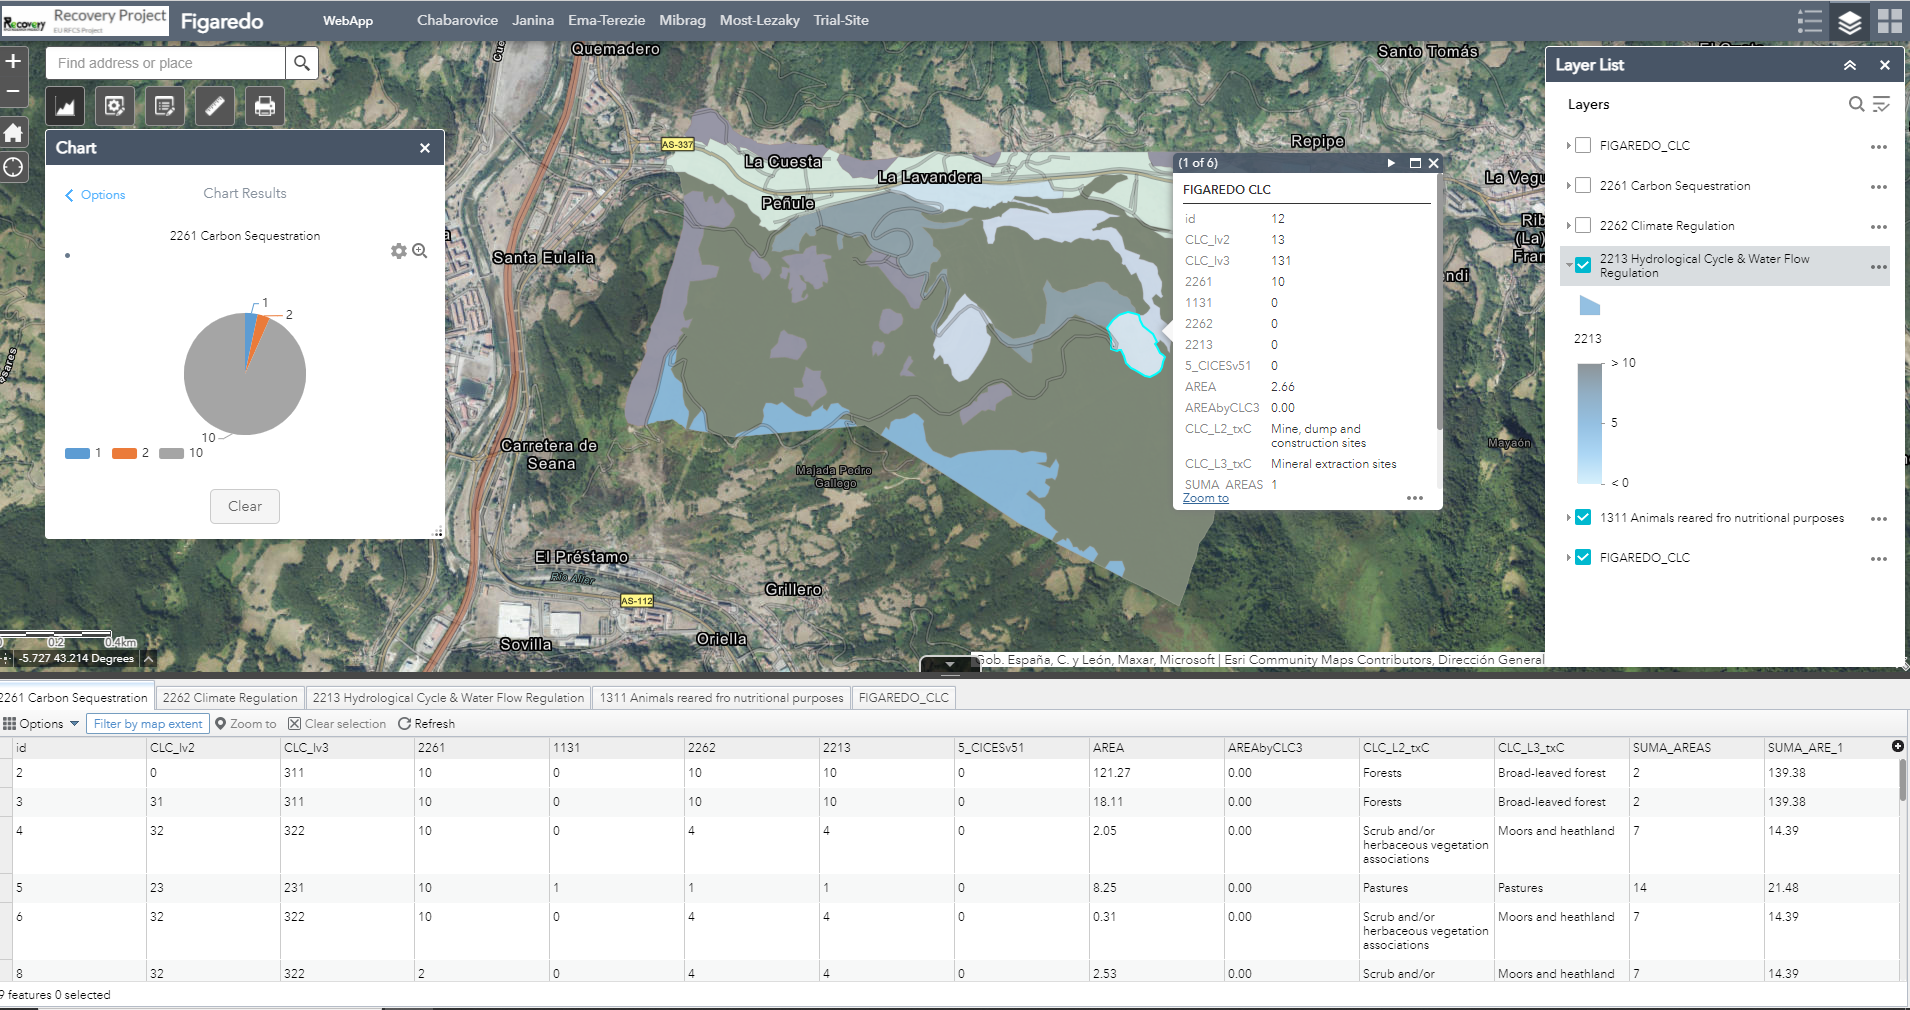
ArcGIS ONLINE WEBGIS
To overcome most of these weaknesses, the spatial data were supply into the platform ArcGIS Online. The Web APP functionality has the following characteristics: attribute table by layer, polygon Geometry edition online, attribute table data edition, polygon interactive context popup, pre-defined charts, existing ecosystem services tabs in attribute table, and links to other mine sites.
The weaknesses of ArcGIS Online are security issues (level of access, cost, …), no field calculation allowed (only static attribute edition), limited geometry edition available, and some practice needed.
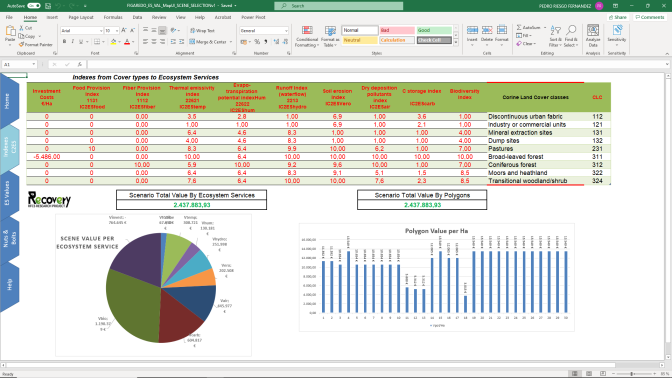
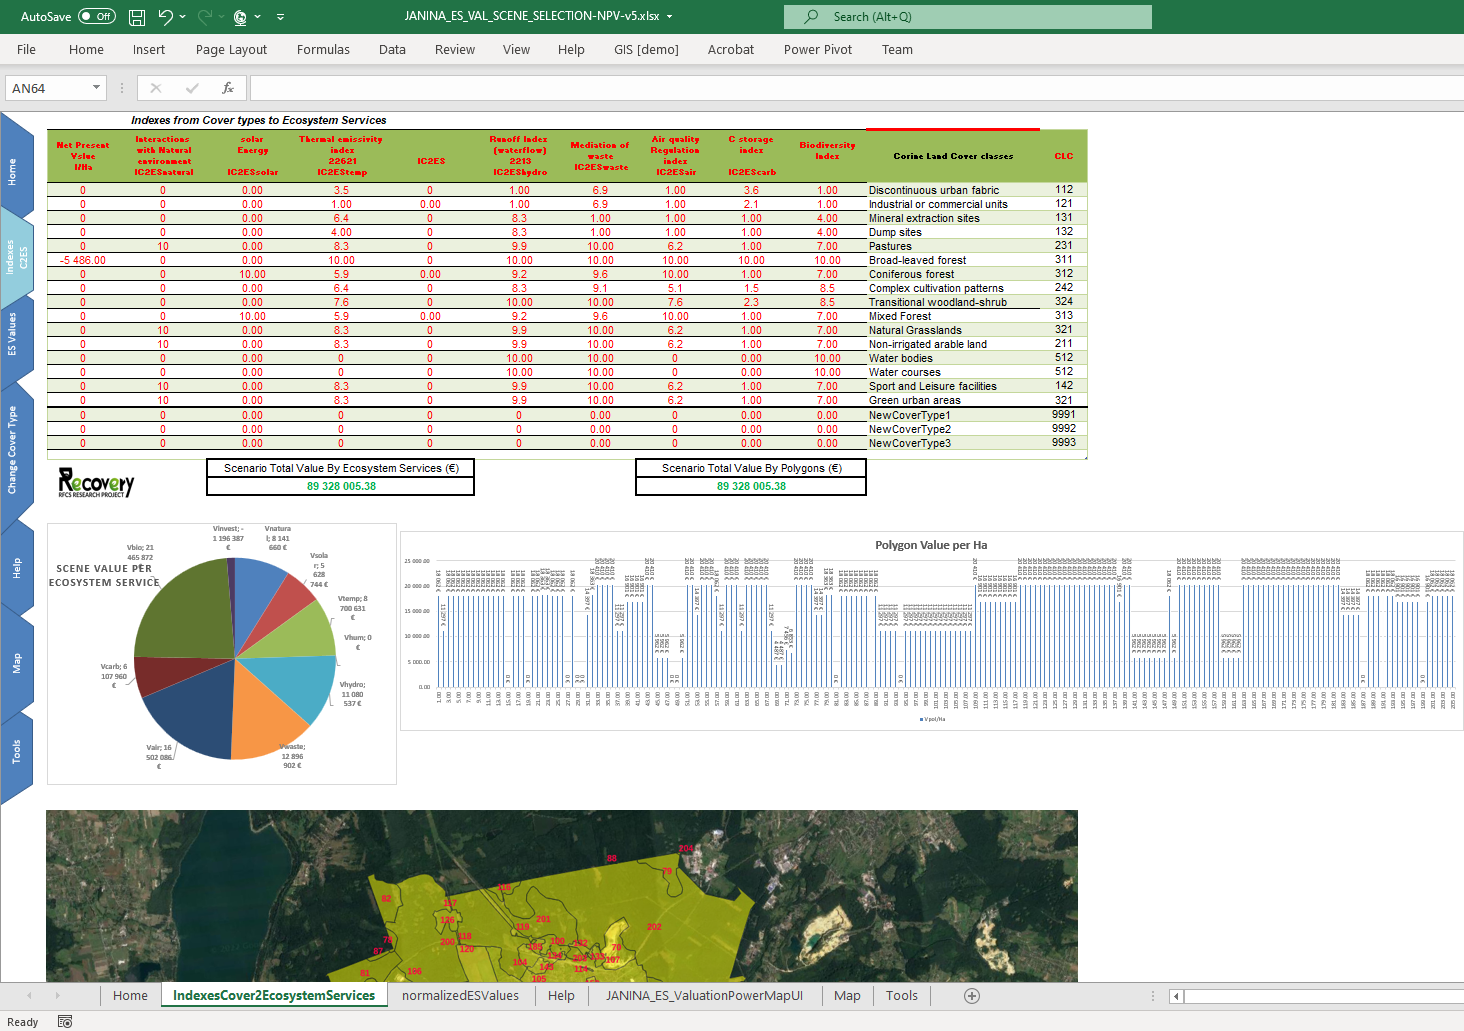
ECONOMIC ASSESSMENT OF ECOSYSTEM SERVICES
The final step will be the economic assessment of Ecosystem Services in the different scenarios. This aspect cannot be developed online through the above mentioned WebGIS due to the technological limitations of the ArcGIS online and the QGIS. Neither of them allows the automatic recalculation of online attributes necessary for the economic assessment of the Ecosystem Services.
On the other hand, the desktop versions of GIS systems do generally allow such calculations, but are not intended for intensive recalculations as the ones that can be done with spreadsheets. It is necessary to include certain special types of attributes such as virtual fields or regular fields with default values in the case of QGIS, and calculated fields in the case of ArcGIS. The latter are not available in ArcGIS Online currently, and the first ones cannot be included in the WebGIS interface with QGIS.
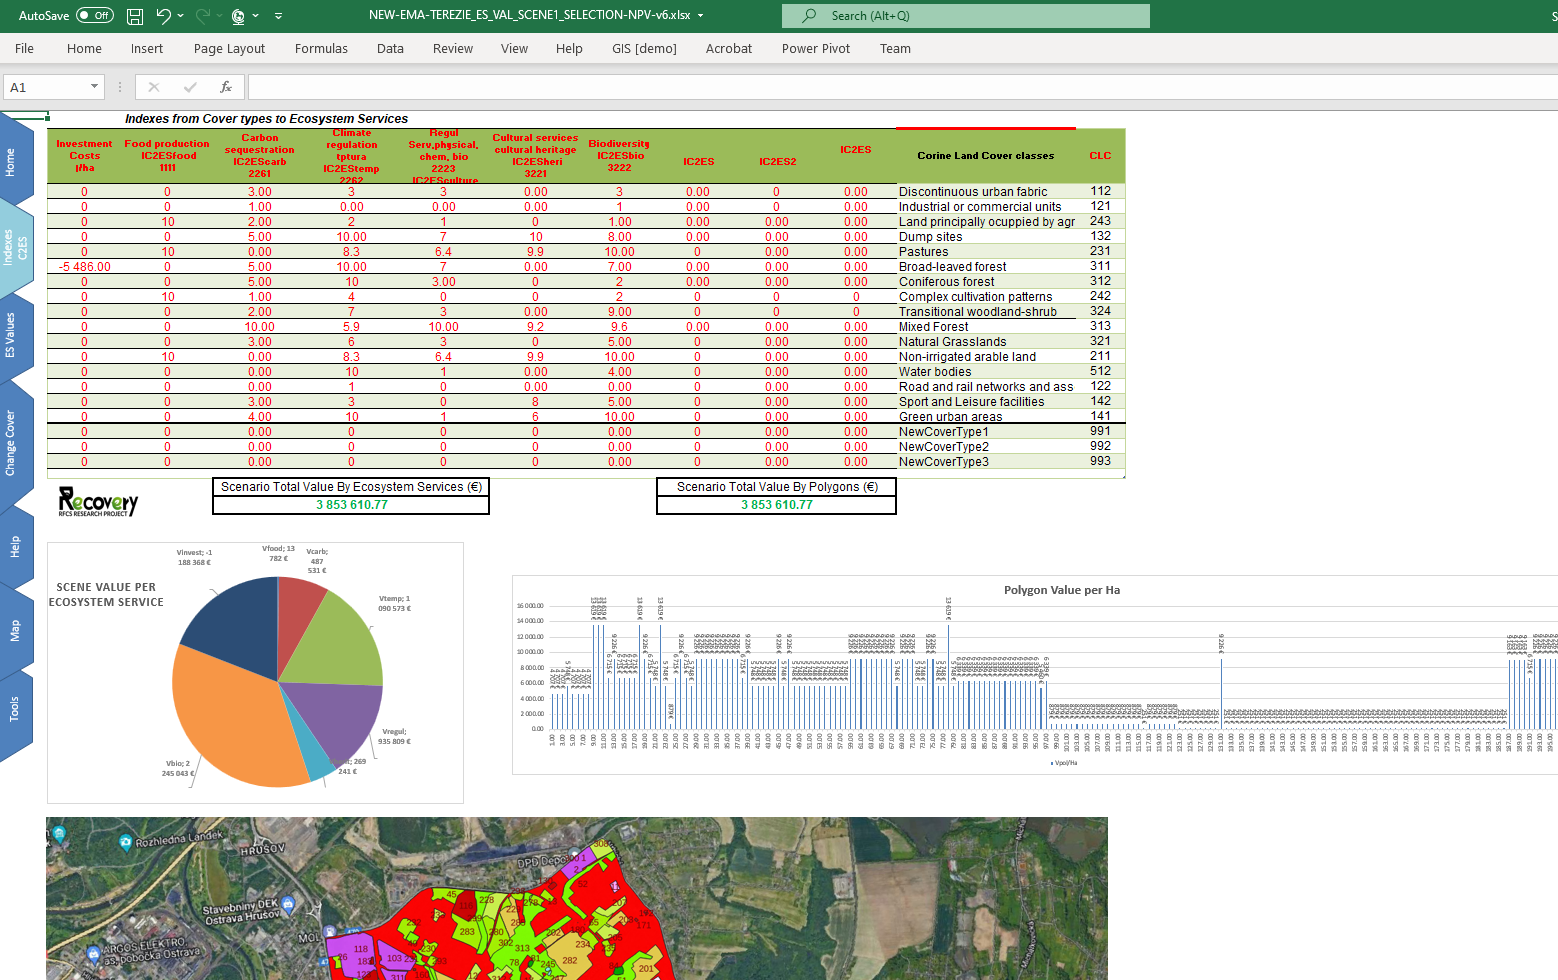
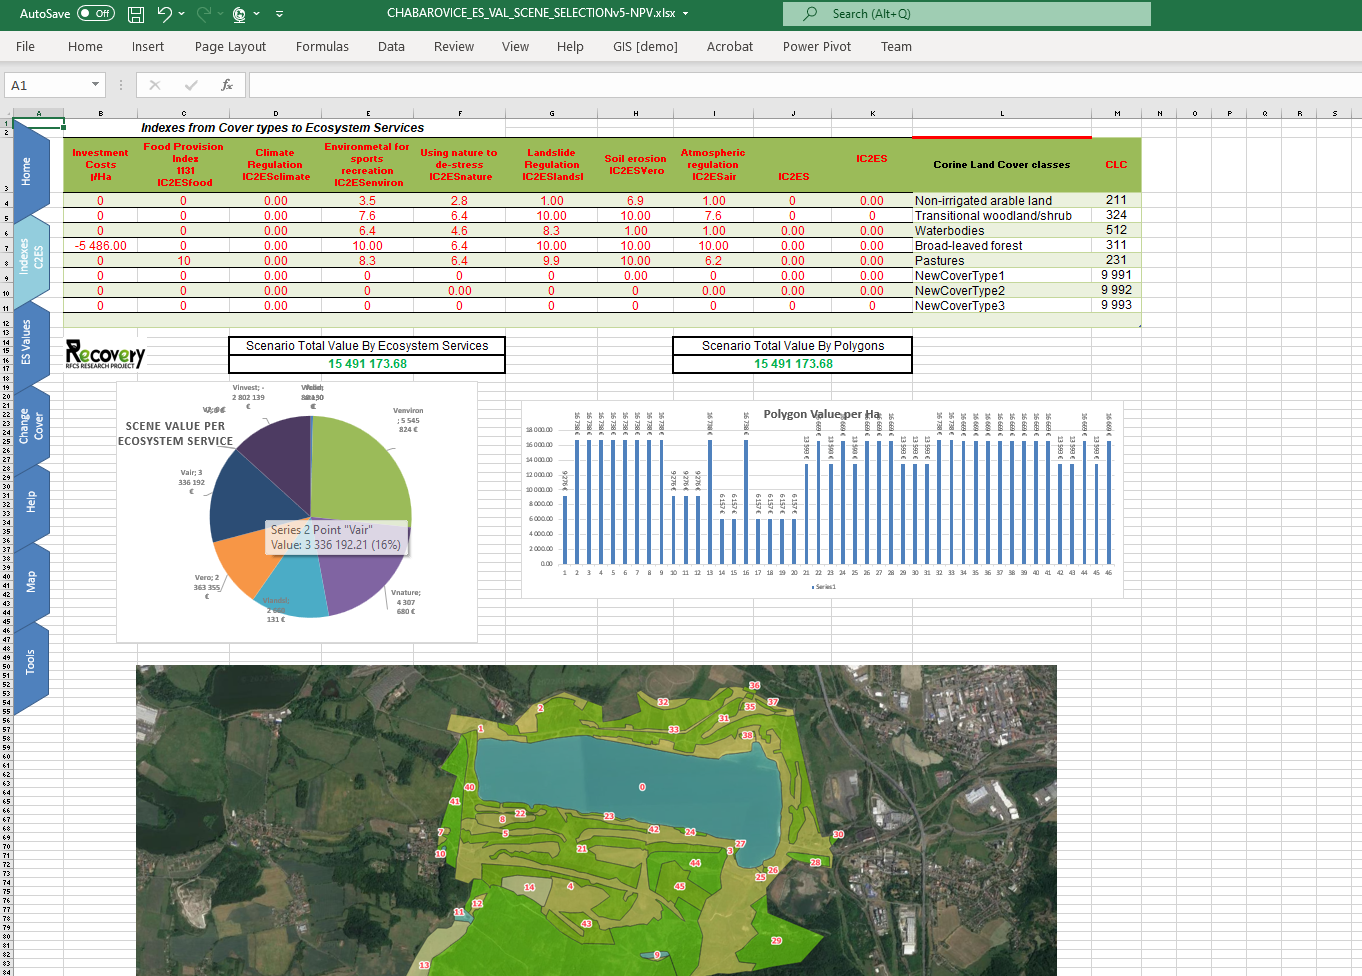
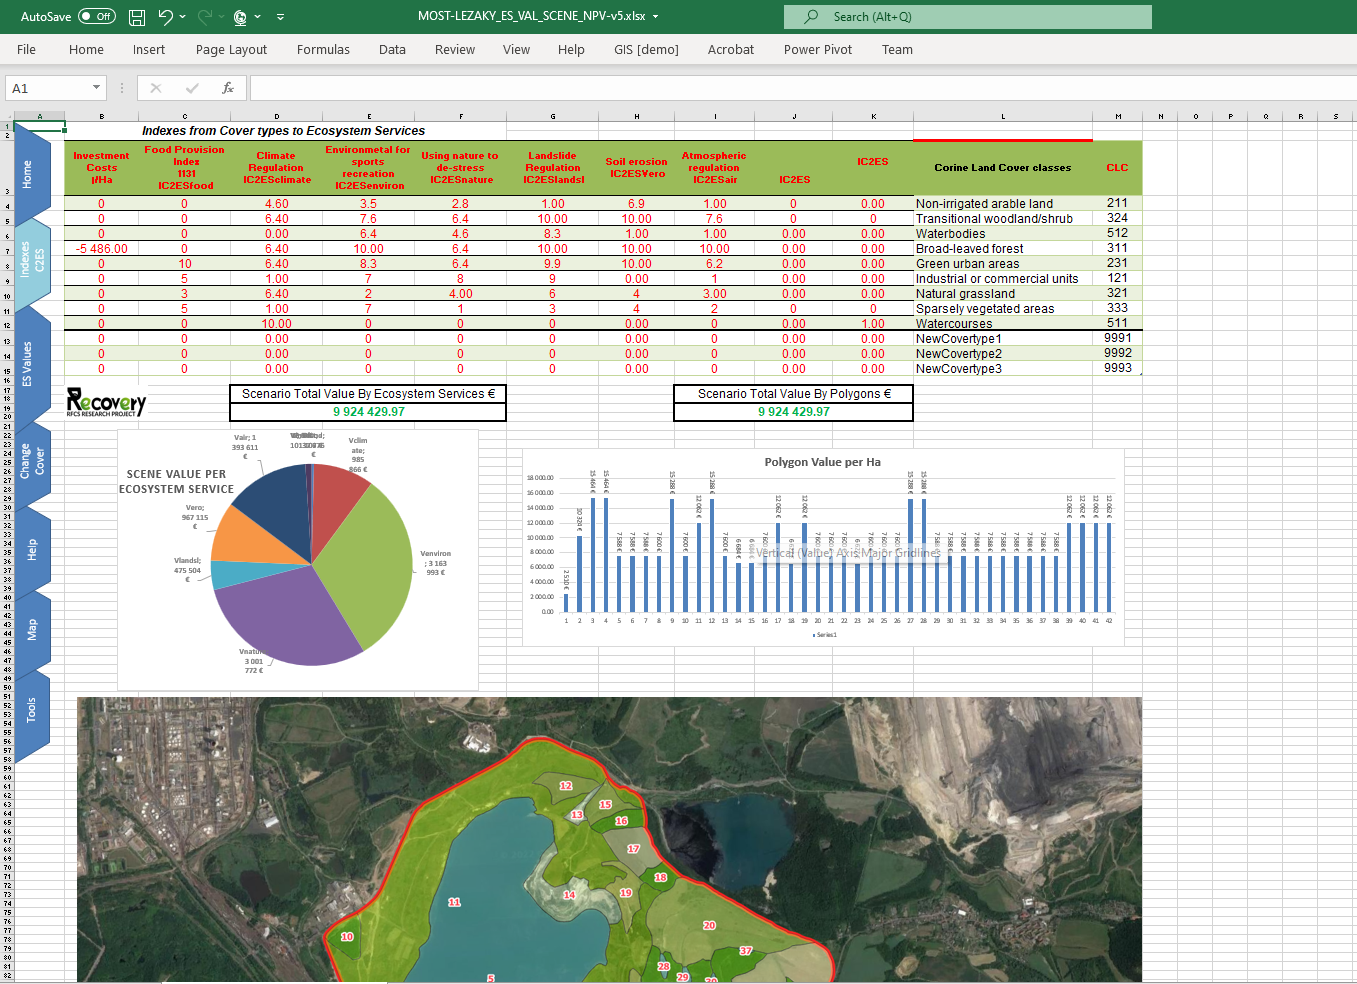
The use of the desktop versions of QGIS would represent an economic and training effort for all the groups involved in the project, not mentioning stakeholders. Therefore, and in order to minimize the economic impact and keep the work environment as accessible as possible for everybody, it was decided to implement a third strategy aimed at the economic assessment of Ecosystem Services using an EXCEL spreadsheet with improvements to achieve user-friendliness.
Thus, two types of tools are provided for each case study:
- A geopackage file that contains all the layers needed to plan the Ecosystem Services scenarios for the different case studies. It can be uploaded on most GIS programs: QGIS, ArcGIS, etc.
- A spreadsheet (EXCEL) with an integrated dashboard that will allow to try different cover types and that calculates automatically the total Ecosystem Services value for a given scenario under a friendly user interface.